Unlock the power of Big Data and Data Visualization with this enlightening guide! Discover the three compelling benefits that are revolutionizing industries and decision-making. Dive into the world of data-driven insights and gain a competitive edge.
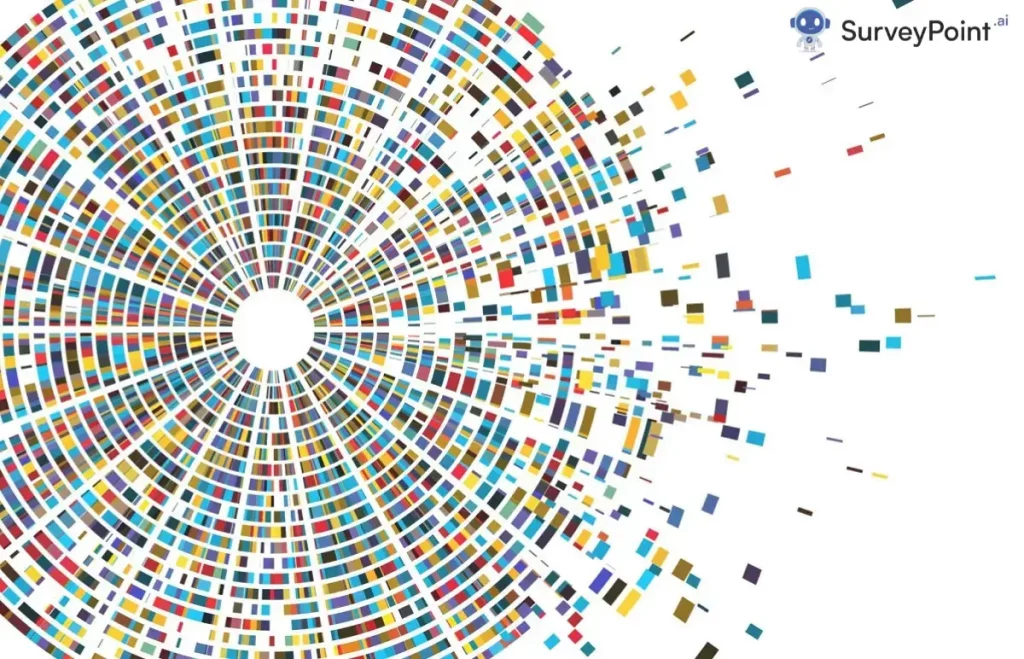
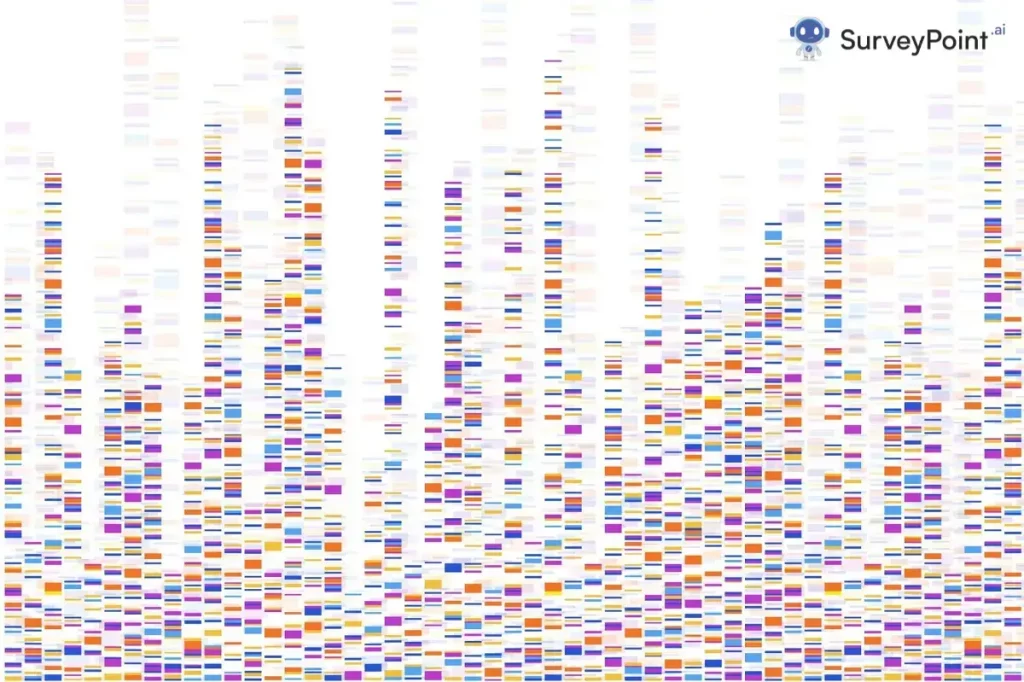
Visualizing data makes it easier to find meaning and business worth in data, especially large amounts of data from many sources. But it’s not easy to see patterns in large amounts of complex data.
This guide looks at the best ways to use data visualization to get insights from big data analytics that give you a competitive edge.
Landscape of Big Data
Big data has features that make it hard to analyze:
- High Volume: Huge amounts of data from Internet of Things sensors, clickstreams, transfers, etc.
- Variety: Text, video, and other formats of structured and unstructured info.
- Velocity: real-time data streaming in addition to batch processing.
- Accuracy and precision of facts are not always the same.
- To use big data effectively, these “4 Vs” need strong tactics.
Advantages of Seeing Big Data
Key perks of effective visualizations for big data analytics are:
- Find big picture trends. – Find big picture patterns in complicated datasets.
- Find differences and outliers. Find odd things and cases.
- Simplify Complexity: Condense multiple data to see how things work together.
- Encourage collaboration by letting teams look at the results together.
- Accelerate Insights: Quickly see the most important points.
- Get better at telling stories. – Make interesting data stories.
- Open up data information to more people who aren’t tech-savvy.
With the right visuals, analyzing big data can be more effective, helpful, and useful.
How to make sense of a lot of data
To make the most of representations of big data:
- Choose platforms for visualizing data that can handle big sets of data without sampling.
- Use pictures to answer specific questions instead of showing too much.
- Summarize and sort information to avoid having too much to think about.
- Use clear, simple charts instead of complicated ones with many parts.
- Set up dashboards that lead people to the most important views.
- Give dynamic features like zooming, filtering, and information when it’s needed.
- Use smart features, like the ability to instantly find insights.
- Change visualizations quickly as new amounts of data come in.
- Build a culture of collaborative data to find answers faster.
You Must Read

Data Visualization: Meaning, Tools and Techniques

Top 10 Data Visualization Tools to Transform Your Data

Data Visualization Demystified: 6 Easy Steps to Visualize Your Data
What to watch out for
- Watch out for these common mistakes when visualizing big data:
- Graphics that are too crowded and have too much information for users.
- Visuals that give the wrong impression of the info.
- For big datasets, slow rendering times make it hard to interact.
- Old snapshots that aren’t connected to real-time info.
- Charts with a lot of variables make it hard to see connections.
- Fixed views make custom exploring harder.
- Unimportant metrics distract from what really counts.
The key is to plan carefully, taking into account the limits of perception, cognition, and platform capabilities.
Important Lessons
With strategic visual analysis, companies can find key insights in their massive, siloed big data. Focus people on what’s important, encourage deep collaboration, and let them explore.
Big data analytics can lead to better business results when the power of display is used. Get information on a large scale!