
Data is an invaluable resource of knowledge. If used correctly, it can help us understand many things and see the larger picture. These days people are realizing the importance of data and using it in various disciplines of life. Experts are also applying the inferences from data to practical life and experience. A concept that has become extremely relevant for the accurate measurement of this data is the nominal ordinal interval ratio.
Data can broadly be divided into two types: quantitative and qualitative. The former is associated with numbers, and the latter is any kind of non-numerical data. To use this data for purposeful actions, we are required to measure whatever subject we are researching.
Data plays a huge role in research & development, which is critical for any organization or business’s growth. Data scientists use various scales to measure or quantify data for deriving valuable findings.
We will examine these measurement scales in more detail as we proceed through this article and understand their significance.
What is a Scale?
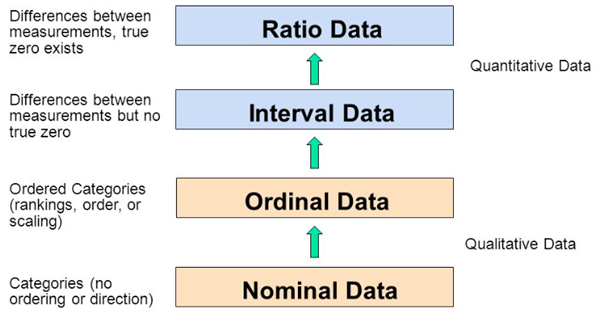
A scale of measurement is a method to define and classify the nature of numbers or variables. In statistics, there are numerous methods to measure data. A psychologist named Stanley Stevens formulated the most popular and widely used scales of measurement. They were the nominal ordinal interval ratio scales.
Each of these scales has its own characteristics and is used for different purposes to align with the needs of data scientists and researchers. Now let’s delve deeper into these four scales with their examples.
ALSO READ: Nominal VS Ordinal Scale: Explore The Difference
Scales of Measurement: Nominal Ordinal Interval Ratio
Nominal Scale
This is the simplest measurement scale used for classifying or identifying data properties. It is also known as the categorical variable scale, and as the name suggests, it categorizes variables into different categories.
The data used for this scale has no numerical digits; thus, calculations like multiplication, division, addition, and subtraction are impossible. We can further divide the nominal scale into the following segments:
- Nominal with order: The nominal data is classified and sub-classified in order, such as very low, low, high, and very high.
- Nominal without order: Data that are classified and subclassified without any order, such as male, female, transgender.
- Dichotomous: This type of data has only two levels or classification levels. For example, true or false, right or wrong, etc.
ALSO READ: A Guide to Measurement & Data Scales
Ordinal Scale
This variable measurement scale’s main objective is to represent data in the order of variables. As the name suggests, the order is the primary use of the ordinal scale. Each variable in this scale is ranked but does not show the difference between the variables. It focuses only on the order of the variables.
The ordinal scale is used to measure non-mathematical concepts like emotions and opinions. In addition to describing variables, this scale provides a relative position of the variables, which is not available on the nominal scale.
A good ordinal scale example can be satisfaction data from marathon runners. The winner will be more satisfied than the runner-up, the third-place runner will be neutral, and those unable to finish the race will be unhappy and dissatisfied.
Sometimes there can be confusion between nominal and ordinal scales as the difference is minute. Let us understand this difference through nominal vs ordinal examples.
Suppose a researcher wants to analyze the level of education among a group of people. In that case, he can either use the nominal or ordinal scales.
A nominal scale will classify people simply as people having high school degrees, college degrees, or master’s degrees without any ranking or order, whereas an ordinal scale will rank people based on their education level.
Interval Scale
As the name suggests, interval means the distance between two objects, and the interval scale helps us in finding the interval or distance between two variables. In simple terms, by using an interval scale, we can find differences between two variables.
Like nominal and ordinal scales, the interval scale also classifies variables, and orders the variables. In addition, it also uncovers the constant and computable differences between the variables. This scale includes numerical data and thus makes it more effective than previous ones.
- Statistical tools such as mean, mode, and median can be used in the interval scale for data analysis. For example, a temperature scale is a very common example of an interval scale. Values are already specified in this scale and measurable in numeric figures.
Ratio Scale
The most used and popular measurement scale is the ratio scale, which includes the characteristics of all the scales mentioned above. In addition to categorizing ratio scale data by identity, organizing it into orders, and containing intervals, it can also tell us the value of zero.
Data in the ratio scale is numeric and can be used for calculations like multiplication, division, addition, and subtraction. The ratio scale has a true zero. In a nutshell, zero refers to the absence of value.
- A few easy-to-understand examples of this are weight and height. Weight and height can not be zero or negative values.
- For market research, also ratio scale is used heavily to calculate shares, consumer base, sales, etc. It is quantitative in nature, and thus ratio scale offers the most detailed and precise information to data scientists and researchers.
Importance of Nominal Ordinal Interval Ratio
All these scales are different levels of the same measuring process. Each of them has its specific purpose, which can be used to serve the requirements of the statistician or researcher for better data analysis.
Understanding the significance of the nominal ordinal interval ratio scale individually can help in leveraging them when needed. These are primarily effective when you are analyzing large-scale data collected by tools like surveys. It assists in making the most of your data and identifying trends.
You can now create comprehensive surveys with SurveyPoint and measure the data using appropriate scales. Get started on your journey of creating attractive surveys and efficient data measurement today!
Not Sure Where To Begin?
Explore our solutions to discover what is most important to your customers,
clients, and prospects. And best of all – it doesn’t take any coding!
Free Trial • No Payment Details Required • Cancel Anytime