Discover the ultimate guide to choosing between Python vs R for data analysis in 2024. Uncover insights, expert opinions, and practical advice to make an informed decision. Dive deep into the comparison of Python and R, exploring their strengths, applications, and future trends.
Data is the new oil.” The power of data in driving insights and making informed decisions cannot be ignored in today’s digital age. Aspiring data analysts and data scientists find themselves faced with a critical question: Python or R? Both programming languages have gained significant popularity in the field of data analysis, each with its unique strengths and weaknesses. In this article, we will delve into the Python vs R debate and help you make an informed decision on which language to learn in 2024 and beyond.
Python for Data Analysis

Python, known for its simplicity and versatility, has become a preferred programming language for data analysis. Here’s why:
1. Wide Range of Libraries and Packages
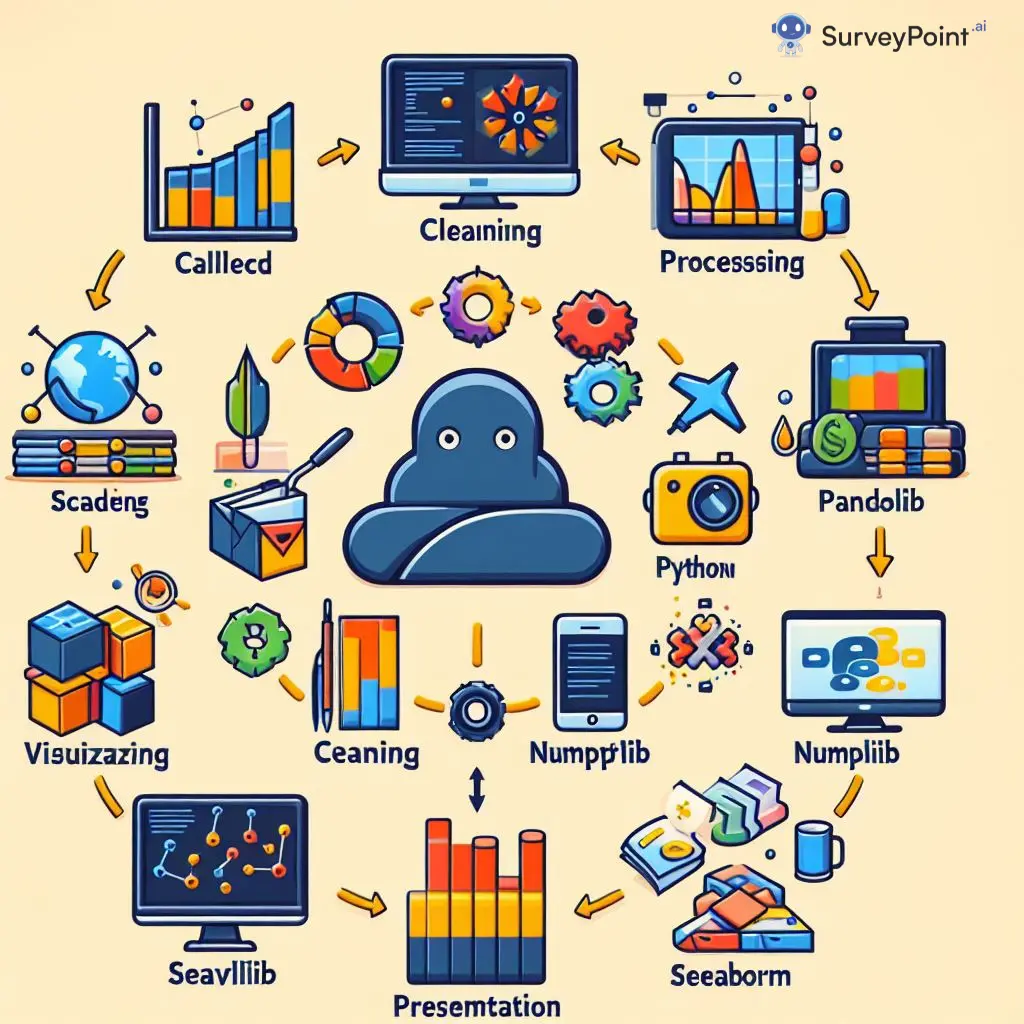
Python boasts an extensive collection of libraries and packages specifically designed for data analysis. Some notable ones include:
NumPy: Provides support for large arrays and matrices, along with a vast collection of mathematical functions.
Pandas: Offers powerful data manipulation and analysis capabilities, including data cleaning, preprocessing, and transformation.
Matplotlib and Seaborn: Enable data visualization and help present findings in a visually appealing manner.
Scikit-learn: Facilitates machine learning tasks and includes various algorithms for regression, classification, and clustering.
2 . General – Purpose Language
Python’s versatility goes beyond data analysis – it is a general-purpose programming language. Learning Python allows you to leverage its capabilities in other domains such as web development, automation, and scientific computing. This versatility opens up a world of opportunities beyond data analysis.
3 . Large and Supportive Community
Python has a thriving community with extensive resources and active forums where beginners can seek guidance and seasoned professionals can share knowledge. The vast community ensures that Python remains updated and relevant to the evolving data analysis needs.
4. Industry Adoption and Job Market
Python has gained significant traction in the industry, with numerous organizations adopting it for their data analysis needs. Learning Python increases your chances of finding a job in the field, as it is widely used across different sectors. According to the TIOBE Index, Python has consistently been one of the most popular programming languages worldwide.
R for Data Analysis

While Python has its advantages, R has carved out its own niche in the data analysis realm. Let’s explore why:
1. Specialized Statistical and Graphical Capabilities
R was specifically developed to cater to statistical analysis and provides a wide array of specialized packages for this purpose. Some notable ones include:
dplyr and tidyverse: Enable efficient data manipulation, transformation, and analysis.
ggplot2: Offers a powerful grammar of graphics for creating complex and visually appealing plots.
Stats package: Provides a comprehensive collection of statistical functions and tests.
2. Reproducibility and Documentation
R’s emphasis on reproducibility makes it a preferred choice for academic research and scientific studies. The ability to write readable code and document your analyses in RMarkdown facilitates collaboration and enables others to replicate your results accurately.
3. Data Visualization and Exploratory Data Analysis (EDA)
R’s graphical capabilities shine in exploratory data analysis and visualization. The combination of packages like ggplot2 and leaflet allows for the creation of stunning visualizations for better understanding and insights.
4. Scholarly Community and Research
R has a strong presence in academia and is commonly used by researchers for statistical modeling, econometrics, and social sciences. The vast number of research articles and textbooks written in R make it a valuable language to learn for those interested in pursuing advanced studies.
You Must Read

8 Effective Survey Sampling Tactics for Transactional Success

Unlocking the Secrets: How Sampling Error Impacts Your Data

Solid Waste Management Questionnaire: How to Create a Surprising Survey in 10 Minutes
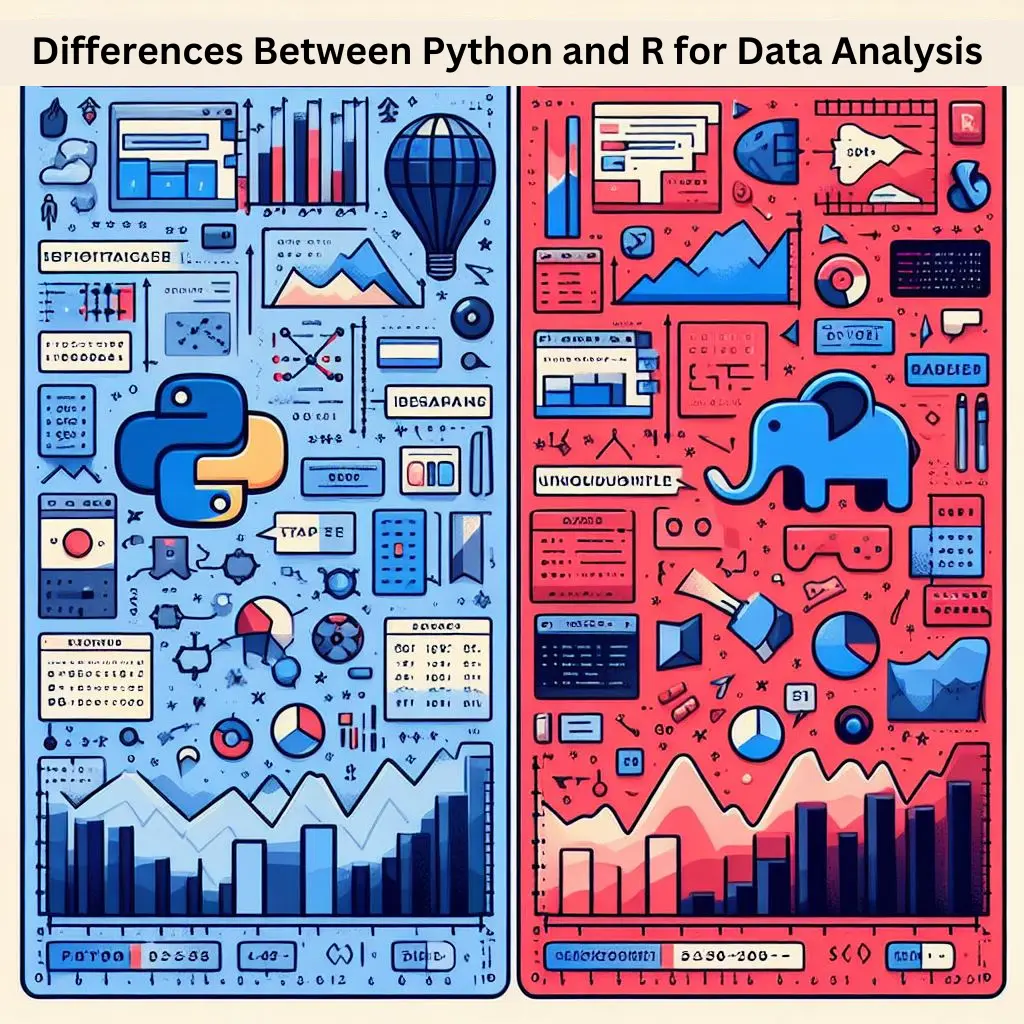
Below is a Table Outlining Key Differences Between Python vs R for Data Analysis:

| Feature | Python | R |
| Syntax | General-purpose language with clear, readable syntax. | Specialized syntax designed for statistical computing. |
| Learning Curve | Relatively easier for beginners with a broad range of applications. | Steeper learning curve, especially for those new to programming. |
| Data Manipulation | Pandas library offers versatile data manipulation capabilities. | DataFrame and Tidyverse packages provide powerful data manipulation tools. |
| Visualization | Matplotlib, Seaborn, and Plotly provide diverse plotting options. | ggplot2 is renowned for its expressive and customizable visualizations. |
| Statistical Support | Strong statistical capabilities but may require additional libraries. | Inherent statistical functions and packages like base stats and dplyr. |
| Community & Libraries | Extensive libraries for various domains, including machine learning. | Well-established in academia with a rich collection of statistical packages. |
| Integration | Widely used in web development, machine learning, and scientific computing. | Commonly used in academia, research, and statistical analysis. |
| Scalability | Powerful for large-scale projects and integration with big data tools. | More suitable for smaller-scale analyses; may require additional tools for big data. |
| Flexibility | Versatile and suitable for a broad range of programming tasks. | Specialized for statistical analysis; less versatile for general programming. |
| Industry Adoption | Highly adopted in industries like finance, tech, and artificial intelligence. | Widely used in academia, research, and industries focused on statistical analysis. |
It’s important to note that the choice between Python vs R for data analysis often depends on the specific needs of the project, the preferences of the user, and the existing infrastructure in a given field.
Frequently Asked Questions (FAQs)
Q: Is Python or R more widely used in industry?
In industry, Python’s versatility and readability have made it more widely adopted compared to R. Its applications span beyond data analysis, making it an essential skill in various domains.
Q: Can I use both Python and R for data analysis?
Absolutely. Many data analysts and scientists leverage the strengths of both languages. Python for its overall versatility and R for specialized statistical tasks.
Q: Which language is better for machine learning?
Python takes the lead in machine learning due to its extensive libraries and frameworks like TensorFlow, PyTorch, and scikit-learn.
Q: Is R only for statistical analysis, or can it be used for other tasks?
While R excels in statistical analysis, it can be used for other tasks. However, its specialization in statistics makes it the preferred choice for researchers and statisticians.
Q: Are there job opportunities for both Python and R professionals?
Yes, there are ample job opportunities for both Python and R professionals. The choice depends on your career goals and the industry you are interested in.
Q: How long does it take to learn Python and R for data analysis?
The learning duration varies, but both Python and R offer resources for beginners. Python’s readability may expedite the learning process for beginners.
Conclusion
Both Python and R offer compelling options for data analysis in 2024. Python’s versatility and industry adoption make it an excellent choice for beginners and those looking to expand their horizons beyond data analysis. On the other hand, R’s specialized statistical and graphical capabilities, along with its popularity in academia, make it a preferred choice for researchers and statisticians.
Ultimately, the decision between Python vs R for data analysis hinges on your specific needs and goals. Consider your areas of interest, the industry you wish to enter, and the resources available to you. Whichever language you choose, remember that mastering data analysis goes beyond programming – it requires a deep understanding of statistical concepts and a passion for uncovering insights from data.
So, are you ready to dive into the exciting world of data analysis? Choose Python or R and embark on a journey that will empower you to make sense of the vast ocean of data that surrounds us.
The world is one big data problem. – Andrew McAfee

