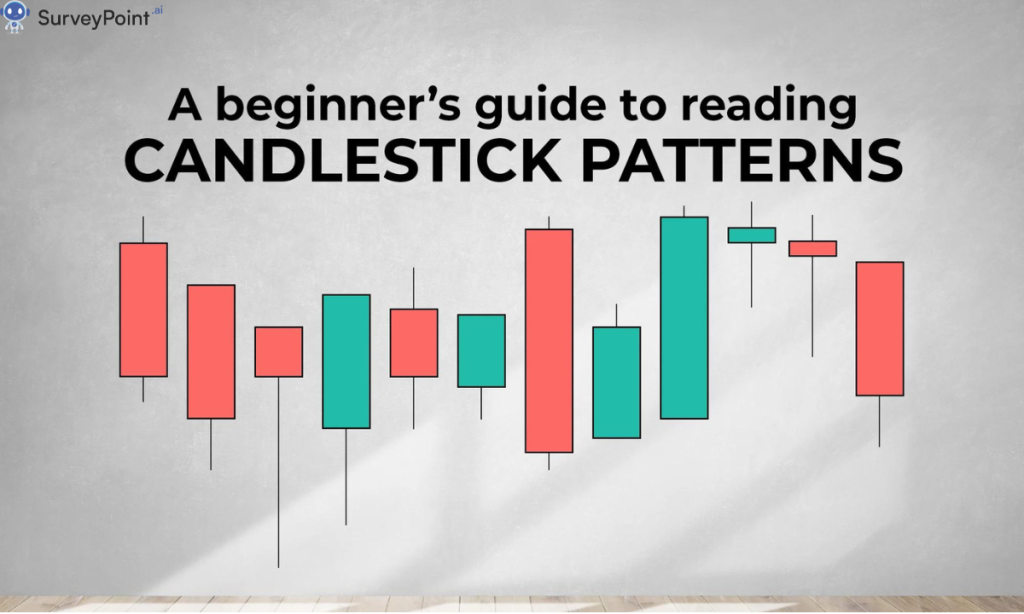
Candlestick charts, futures, and options are essential tools in the arsenal of investors and traders. These instruments help in analyzing market trends, making informed decisions, and managing risk. In this blog, we will delve into the basics of candlestick charts and explain the concepts of futures and options, providing a comprehensive guide for those looking to enhance their investment strategies.
Candlestick Charts: The Basics
Candlestick charts are a type of financial chart used to represent price movements of securities over a specific period. Originating from Japan, they have become one of the most popular tools among traders due to their visual appeal and the wealth of information they convey.
Components of a Candlestick
Each candlestick consists of four main components:
- Open: The opening price of the security at the beginning of the period.
- Close: The closing price at the end of the period.
- High: The highest price reached during the period.
- Low: The lowest price reached during the period.
The body of the candlestick, also known as the “real body,” represents the range between the open and close prices. The lines extending from the body, known as “shadows” or “wicks,” represent the high and low prices.
Types of Candlesticks
- Bullish Candlestick: When the closing price is higher than the opening price, the candlestick is typically colored green or white, indicating upward price movement.
- Bearish Candlestick: When the closing price is lower than the opening price, the candlestick is usually colored red or black, indicating downward price movement.
Common Candlestick Patterns
- Doji: When the open and close prices are nearly the same, indicating market indecision.
- Hammer: A short body with a long lower shadow, signaling a potential reversal from a downtrend to an uptrend.
- Engulfing: A larger candlestick that completely engulfs the previous one, indicating a potential reversal in trend.
Futures: A Closer Look
Futures are financial contracts obligating the buyer to purchase an asset or the seller to sell an asset at a predetermined future date and price. They are commonly used for commodities, currencies, and financial instruments.
Key Features of Futures
- Standardization: Futures contracts are standardized in terms of contract size, expiration date, and tick size, making them easily tradable on exchanges.
- Leverage: Futures allow traders to control large positions with a relatively small amount of capital, amplifying potential gains and losses.
- Hedging and Speculation: Futures can be used to hedge against price risk or to speculate on price movements.
Example of Futures Trading
Suppose a trader believes that the price of gold will increase in the next three months. They can buy a gold futures contract at the current price. If the price of gold rises by the expiration date, the trader can sell the contract at the higher price, profiting from the price difference.
Options: An Overview
Options are financial derivatives that give the buyer the right, but not the obligation, to buy or sell an underlying asset at a specified price within a certain period.
Types of Options
- Call Options: Give the holder the right to buy an asset at a predetermined price (strike price) before or on the expiration date.
- Put Options: Give the holder the right to sell an asset at the strike price before or on the expiration date.
Key Features of Options
- Premium: The price paid by the buyer to the seller for the option contract.
- Leverage: Options provide leverage, allowing traders to control large positions with a relatively small investment.
- Flexibility: Options can be used for various strategies, including hedging, income generation, and speculation.
Example of Options Trading
Suppose an investor expects a company’s stock price to rise. They can buy a call option with a strike price of $50, paying a premium of $2. If the stock price rises to $60 before expiration, the investor can exercise the option to buy the stock at $50 and sell it at $60, making a profit (minus the premium paid).
Combining Candlestick Charts with Futures and Options
Understanding candlestick charts can significantly enhance trading strategies involving futures and options. By analyzing candlestick patterns, traders can identify potential market reversals, continuations, and trends, making more informed decisions on when to enter or exit positions in futures and options.
Example Strategy
- Identify Trends: Use candlestick charts to identify prevailing market trends.
- Confirm with Patterns: Look for confirming candlestick patterns, such as a bullish engulfing pattern during an uptrend.
- Execute Trades: Based on the analysis, execute futures or options trades to capitalize on anticipated price movements.
Conclusion
Candlestick charts, futures, and options are powerful tools that, when used together, can provide valuable insights and opportunities in financial markets. By mastering these instruments, investors and traders can enhance their decision-making processes, manage risk more effectively, and potentially achieve better returns on their investments. Whether you are a seasoned trader or a novice investor, understanding these concepts is crucial for navigating the complexities of modern financial markets. For more information checkout- surveypoint.ai


