
Has your survey result ever matched your survey population size? We bet not. Calculating your margin of error can give you a good idea of the accuracy of your results.
Are you wondering what the margin of error is? We have got you covered. Read on to explore what t is and how you can calculate it.
What Is The Margin Of Error?
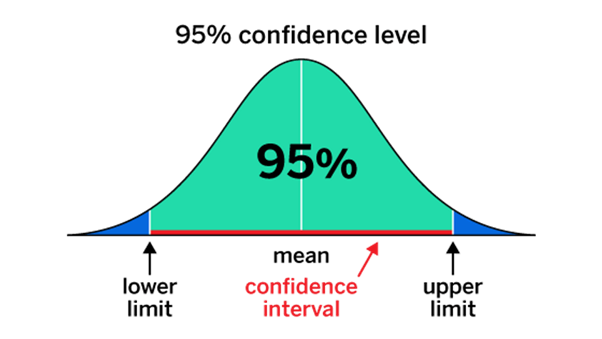
The margin of error, also called the confidence interval, measures the amount of sampling error inherent in the survey results. Sampling errors occur whenever a subset of a population is studied instead of the entire population as a whole.
The total number of respondents and the confidence level required for the survey results are considered. This is calculated based on the size of the sample and the confidence level desired by the surveyor.
For example, researchers might report a margin of error of 3.1% with a 95% confidence level if they randomly sample 1,000 people from a population of 1,000,000 and find that 50% favour a particular political candidate.
This means that if they were to take 100 random samples of the same size from the population, 95 would have a result within +/- 3.1% of the true support value for the candidate in the population.
A survey’s margin of error shows the room for error in interpreting the results. Thus, it’s crucial to take this into account when doing so.
NOTE: The confidence interval does not account for non-response, measurement error, or other potential sources of error.
ALSO READ: Studying Population Data: Meaning, Characteristics & Importance
Calculating Margin Of Error
Here’s the formula for calculating the confidence interval:
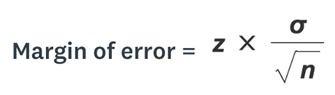
Here,
n = sample size
σ = Standard Deviation
z = z-score/confidence level
In a nutshell, you need to determine the population’s sample size and standard deviation. Once you have done that, estimate the square root of the sample size and divide it by your calculated standard deviation. Lastly, multiply the result by the z-score.
Let’s take a look at an example.
Imagine that you have to choose between “A” and “B” for the name of your new product. Your target market consists of around 4000 potential customers, out of which you decided your sample size as 600.
To move forth, you should calculate your confidence level. This level determines how confident you are that your sample would reflect the overall attitude of all 4000 potential customers. Most researchers usually assume their confidence level as 90%, 95% or 99%.
With your confidence level at 95%, your margin of error would be 4% if you use the above formula.
So, if your confidence level determined that 90% of your sample would choose “A,” you have a 95% chance of it being confirmed.
How Can Sample Size Affect Confidence Interval?
The sample size is an essential factor that can significantly affect the margin of error in a survey. In general, a larger sample size will result in a smaller margin of error. As a result, a smaller sample size will lead to a greater margin of error.
Here are a few reasons why sample size affects the margin of error:
Law of Large Numbers
This law states that the sample mean will approach the valid population means as the sample size increases. This means that with a larger sample size, the sample will be more representative of the population, and the margin of error will be smaller.
Sampling Distribution
The margin of error is based on sampling distribution, which is the distribution of all possible sample means that could be obtained from a population.
With the sample size increasing, the sampling distribution becomes normal, and the standard error of the mean decreases, resulting in a smaller margin of error.
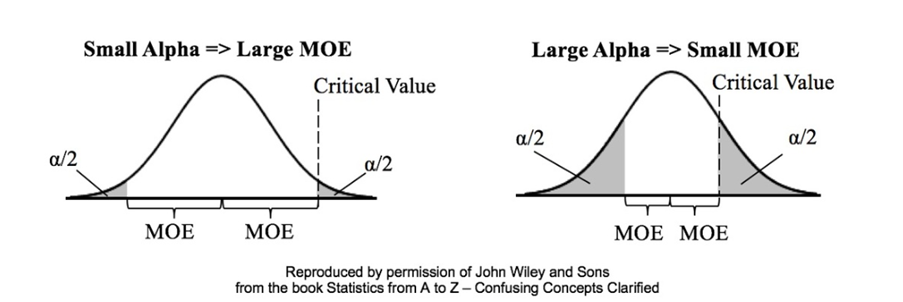
Confidence Level
The margin of error is also affected by the desired confidence level of the survey. A higher confidence level will result in a larger margin of error, while a lower confidence level will result in a smaller margin of error.
For the same level of precision, a larger sample size is required to achieve a higher confidence level.
Population Variability
The variability of the population also influences the margin of error. A high level of variability in a population requires a larger sample size, resulting in a smaller margin of error.
On the other hand, if the population is relatively homogeneous, a smaller sample size may be sufficient, resulting in a larger margin of error.
Practical Limitations
Finally, the margin of error may be affected by practical limitations such as time, cost, or accessibility.
A larger sample size may be desirable for greater precision. Still, it may not be feasible in terms of resources or time constraints.
ALSO READ: Consequences of Poor Data Quality: Why It's Far Too Risky
How To Increase Your Data’s Reliability?
Increasing data reliability is critical to ensuring that decisions and actions based on that data are compelling. One important aspect of data reliability is the confidence interval’s accuracy, which measures the range within which the true population value is expected to lie.
Estimating the right population size can increase the confidence interval’s accuracy and improve the data’s reliability.
Here are the steps to calculate the right sample size to estimate the population:
Define Total Population
The first step is to define the total population you want to study. This could be a geographic region, a specific demographic group, or another relevant population.
Determine the Level of Accuracy You Want to Achieve
Next, you need to determine the level of accuracy you want to achieve in your estimate. This is typically expressed as a percentage, such as a 95% confidence interval.
Define Sample Size
You can then calculate the sample size you need based on the level of accuracy you want to achieve.
Statistical accuracy depends on how many people you need to study or survey. Design your sample so that the margin of error is within an acceptable range.
Calculate Response Rate
Once you have defined the sample size, you need to calculate the response rate, which is the percentage of respondents to your survey or study. A higher response rate will generally lead to more reliable data, reducing the risk of non-response bias.
ALSO READ: Creating Smiley Face Surveys To Enhance Response Rate
Calculate the Total Number of Responses
Finally, you can calculate the total number of responses you need to achieve the desired level of accuracy. This is the product of the sample size and the response rate.
Estimating the right population size is crucial because it ensures the sample size is appropriate for the studied population. The sample size may be too large if the population is overestimated, resulting in unnecessary costs and time.
If the population size is underestimated, the sample size may be too small, resulting in inaccurate estimates and low data reliability. By accurately estimating the population size, the confidence interval becomes more accurate, improving the reliability of the data.
The Takeaway
The margin of error can help you set your expectations straight when conducting a survey. Remember that in a survey, you are selecting a sample that reflects the entire target audience. Determining your sample size is the best way to improve your survey accuracy.
Frequently Asked Questions
Q1. What is a good margin of error for a survey?
As a rule of thumb, the margin of error for a survey with 95% confidence should be between 4% and 8%. It’s sensitive to both the size of the sample and the proportion of the whole population.
Q2: What is a high margin of error?
The statistical margin of error describes how survey results derived from random samples deviate from the true value.
In statistics, a larger margin of error means that there is less confidence in the results of a survey or poll to represent a population.
Q3. What does a margin of error of 5% mean?
A margin of error is a range of possible numbers from a survey, both higher and lower than what actually was obtained.
If 60% of respondents said “yes,” and the margin of error was 5%, then between 55% and 65% of the public would agree with that assessment.
Learn to work smarter, not harder!
Use our intuitive survey dashboard panel to identify respondents in even the most niche markets.
Free Trial • No Payment Details Required • Cancel Anytime