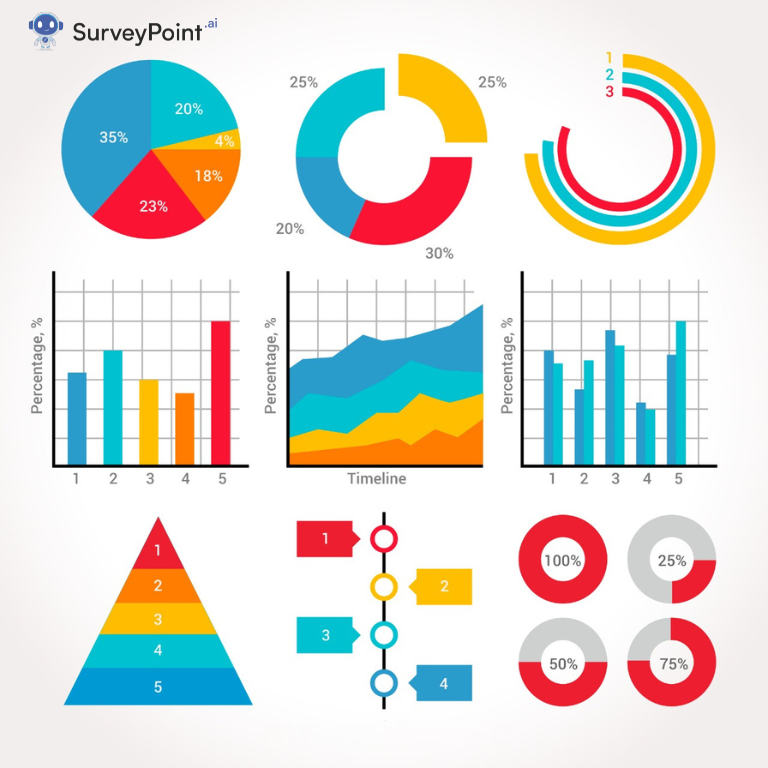
We’ve all studied pie charts in school, haven’t we? But have you ever heard about a Google Forms pie chart? Google Forms pie chart results are a great way to represent the data gathered through responses in Google Forms visually. One can create attractive pie charts for representing data using a Google Forms pie chart maker.
To provide a summary, this blog will discuss the meaning of Google Form pie charts, how to make a pie chart in Google Sheets, and much more.
So, without further ado, let us begin by understanding exactly what a Google Forms pie chart is. However, first, let us know what a pie chart is.
What is a Pie Chart?
Before we jump to an essential part, shouldn’t we briefly explain what a pie chart is?
The Internet says pie charts, sometimes called circle charts, are round representations of data in statistics. It’s cut into pieces (like a pie) to show how the numbers break up. The value shown in a pie chart is the same as the size of a slice or the radius of an arc that describes it (whole pie).
In other words, the whole “pie” stands for everything, and each “slice” stands for a certain amount of everything. The pie chart shows us the data in a way that helps us make decisions faster. They are helpful when you must show how a whole thing can be broken into smaller parts. Or, they can be used when seeing information about time is unimportant. Even better, it is used everywhere, from classrooms to business meetings.
People have said that it takes a lot of work to compare and understand different data subsets. Since Google Forms is still used for serious research, we will look at how to make a pie chart in google forms.
Can Google Forms be Used to Make Pie Charts?
Users have been able to make questionnaires and run surveys with Google Forms for a while now. You can use the forms to do online surveys with small or large sample sizes, and respondents can choose how they want to send in their answers.
Google Forms have a built-in summary tool that turns answers into charts and graphs that are easier to understand but more flexible than other options. The user can’t change the type of graph or the titles or subtitles.
You can combine your Google Forms data with many ways to see it in Google Sheets. Google Sheets works with Google Forms, making it easy to export Forms data and make flexible graphs and charts.
What is Google Forms Pie Chart?
A Google Forms pie chart is a way to show data visually. It looks like a circle with slices or wedges cut out of it. Each slice or wedge shows a proportion or percentage of the whole. It’s a quick and easy way to see how different people answered a specific question in a survey or poll. For example, if you asked people to choose their favorite color, a pie chart could show how many chose red, blue, green, and so on. The number of people who decided on that option increased with the slice’s size. One can use google form pie chart maker to create accurate pie charts.
Importance of Google Forms Pie Chart
A Google Forms pie chart is essential because it can show complex data in a way that is simple and easy to understand. Pie charts make it easy to see how the answers are spread among the choices. This makes it easy to spot trends and patterns. This can be especially helpful when looking at a lot of data or deciding what to do based on the survey or poll results. Also, google forms pie chart results are a great way to show data to others because they are exciting and can help people understand what is being offered.
Moving forward, let us see how to make a pie chart in google sheets.
Pie Chart in Google Sheets
Using the following steps, one can learn how to make a pie chart in google sheets.
Step 1: Launch Google Sheets and open a new or existing spreadsheet.
Step 2: Fill out the spreadsheet with your data. Make sure that each data point has a label.
Step 3: Choose the information you want to use for your pie chart and mark it.
Step 4: Click the “Insert” menu at the top of the screen.
Step 5: Choose “Chart” from the menu that drops down.
Step 6: When the “Chart editor” window opens, choose “Pie chart” from the list of options on the left.
Step 7: Change any formatting or personalization settings as you like.
Step 8: To add the pie chart to your sheet, click “Insert.”
You can also make a pie chart directly from a Google Form by clicking the “Responses” tab and then the “Summary” tab. You may then generate a pie chart based on replies to a specific question in your form.
Following this, it’s time to discuss how to change pie charts to bar charts in the google form.
Pie Chart to Bar Chart
Using the following steps, you can learn how to change a pie chart to a bar chart in the google form.
Step 1: Click on the “Responses” tab in your Google Form.
Step 2: Find the question whose chart type you want to change.
Step 3: Click the three dots in the question box’s upper right corner.
Step 4: From the drop-down menu, choose “Change chart.”
Step 5: When the “Chart editor” window opens, choose “Bar chart” from the list of options on the left.
Step 6: Change any formatting or personalization settings as you like.
Step 7: Click “Save” to change the type of chart.
If you change the chart type in a Google Form, the chart will also change in any linked Google Sheets document. If you want to modify the chart type in Google Sheets, select the chart and then click the “Chart editor” button. You can change the chart type to a bar chart or any other option apart from Google Forms pie chart results.
How to Make Google Form Pie Chart Quiz
You can use the following steps to create a Google Form pie chart quiz.
Step 1: Start by opening Google Forms and making a new form.
Step 2: Add a question that asks people to choose their favorite option from a list. For example, you could list colors like red, blue, green, etc., and ask them to pick their favorite one.
Step 3: Click on the “Responses” tab after you’ve added the question.
Step 4: Click the “Summary” tab next.
Step 5: You can make a chart based on the questions and answers by clicking on the pie chart icon in the top right corner of the page.
Step 6: Change any formatting or personalization settings as you like.
Step 7: Put the pie chart in your Google Drive.
Step 8: Add the pie chart to your quiz by putting an image in the right question or section.
Note: A pie chart can be used to show data in a quiz, but it can’t be used to grade the quiz or figure out the correct answers. Use the quiz feature on Google Forms or a third-party tool to make a quiz with correct answers and grading. One can also learn how to make a pie chart on google forms on iPhone for easy access.
Conclusion
In conclusion, pie charts in Google Forms are a fantastic way to visualize data and see patterns in a survey or poll results. They are easy to make and can give helpful information about how people choose different options. Using Google Forms pie charts can help you quickly and easily make sense of a lot of data and share what you’ve learned with others, whether you’re doing it for personal or professional reasons. Overall, pie charts are a great addition to the tools that come with Google Forms and can help anyone who wants to learn more from survey data.
However, you can use Survey Point for a seamless survey-building experience. It provides a wide range of interactive survey options. With Survey Point, you can also change and add different things to your surveys.
So, ultimately, it’s your call to choose the best!


