
What is nominal data? How is it collected and measured? And how do you analyze it? Well, we have all your questions answered below. Read on!
Data is universal!
Whether you’re a salesman, marketing executive, or computer engineer, you can do nothing to escape from data analytics.
And when it boils down to data analysis, nominal data is surely one of the most common way of analysing the information.
Now, you don’t have to be ‘Mr. Know It All’ on this topic (unless you’re a statistician). However, you do require to have a basic grasp of the concept.
This blog will explain in layman’s terms what nominal data is, its characteristics and examples, and how you can gather and analyze it.
So, let’s jump right into it!
What Is Nominal Data?
Nominal data is inspired by the Latin word “nomen,” which means name. It is a type of categorical data, meaning that it is qualitative.
When analyzing the data, you cannot determine the order. Hence, even if you change the order of the data, it does not impact its significance.
Nominal data is at the bottom of the data measurement scale, meaning it is the simplest, least accurate level of measurement. Obviously, this does not mean it is worthless!
Related: Nominal, Interval, Ordinal Scale: A Guide To Measurements & Data ScalesNominal Data Examples
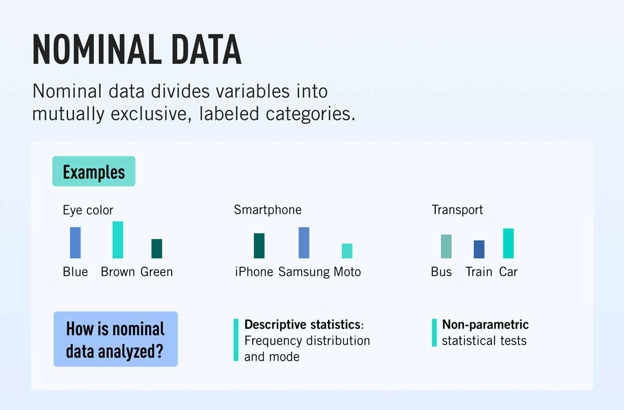
Here are five examples of nominal data to help you clear your doubts:
- Eye Colors: Amber, Blue, Brown, Gray, Green, Hazel, or Red
- Pin Code: 433001, 432056, 411375
- Examination Results Status: Pass or Fail
- Movie Genres: Adventure, Horror, Comedy, Romance, and Satire
- Nationality: American, British, Russian, Indian
To sum up, nominal data is all about describing attributes. Having understood these examples, let’s examine their characteristics!
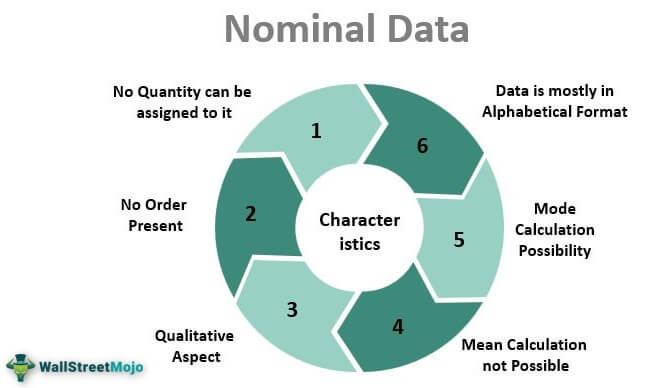
Key Characteristics

Here are the key characteristics of nominal data:
Qualitative
This means, you cannot measure it. Nominal data is completely descriptive and is categorized into multiple groups.
As the data is qualitative, you cannot perform any statistical, logical, or numerical analysis.
Cannot Be Organized Or Ranked
As the data is qualitative, you cannot arrange it in any specific order or hierarchy. So there are no larger or more valuable categories.
Cannot Provide You With A Mean Or Median Value
As the data has no numerical aspect to it, you cannot calculate its mean or median value. Even if you sort the data alphabetically, you still cannot calculate its mean or median.
Mode Value
The number that occurs in the data most number of time is known as mode. As the values here are qualitative, you can calculate the mode value of the dataset.
Primarily Alphabetical
When it comes to nominal data, it is usually alphabetical and not numerical. Thus, you can only group this data into multiple groups.
Related: Nominal VS Ordinal Scale!How Can You Collect Nominal Data?
Nominal data provides you with insights into your target audiences’ minds.
Usually, these insights are collected via surveys or questionnaires. It can either be done online, on the phone, or face-to-face.
There are two ways to collect data: asking open-ended or closed-ended questions.
Use close-ended questions if the variable you’re surveying has limited labels that can represent all the data.
Examples of closed-ended questions are as follows:
Question 1: Are you eligible to vote?
Possible answers: Yes, No
Question 2: Do you own an iPhone?
Possible answers: Yes, No, I prefer not to answer
On the other hand, if your variable of interest has endless possible categories where the respondents are forced to put their answers into words, you can opt for open-ended questions.
Examples of open-ended questions are as follows:
Question 1: What is the zip code of your place of residence?
Question 2: What is your native language?
ALSO READ: Understanding Social Research: A Way To Cater To The Society How To Analyze Nominal Data?
How can one analyze nominal data if it is descriptive? Is it even possible to analyze it and find something helpful?
Yes, you can!
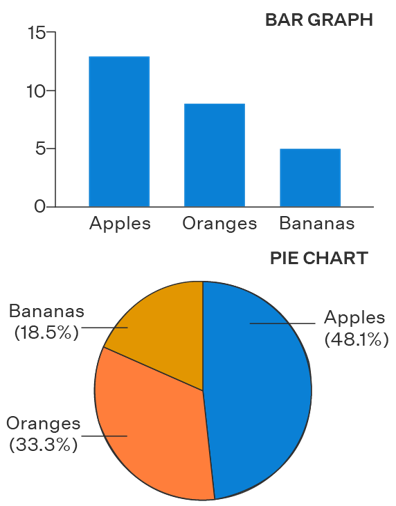
You can do so by organizing and visualizing your data into tables and charts. Then, you can use descriptive statistics to calculate your data’s central tendency and frequency distribution.
Follow these general steps to analyze nominal data:
Descriptive Statistics
Descriptive statistics show you how your data is distributed. Commonly used descriptive statistics methods are:
- Frequency distribution table: Frequency tables allow you to bring some order to your data. It contains the number of responses for each variable category. Thus, you can use this table to create graphs and charts to visualize your data.

- Central tendency: Also known as a mode, this term tells you where most of your values lie. You can calculate only the mode using the central tendency, as nominal data is purely qualitative.
You can identify the mode by highlighting the most common value in your frequency table.
Statistical Tests
While descriptive statistics are limited to summarizing nominal data for basic analysis, inferential statistics take it further. It allows you to test theories about the data by carefully examining it.
You should use the following when analyzing:
- Chi-square goodness of fit test, if you’re interested in a single variable
- Chi-square test of independence, if you’re interested in two variables
Chi-square goodness of fit test: It is used once you gather a random sample from the population. It determines whether your sample is representative of the whole population.
Chi-square independence test: This test examines the significance of a relationship between two nominal variables. Hypotheses testing helps you question the independence of two nominal variables from the same sample.
Conclusion
Nominal data is one of the simplest and most commonly used data types.
As opposed to ratio and integral data types, nominal data fails in terms of magnitude and equal intervals. That does not make it less valuable tool for research and drawing conclusions.
Which is why businesses still use it despite its shortcomings to better understand their customers.
You must also utilize it to enhance your business and connect with your customers.
And, SurveyPoint will help you with it!
SurveyPoint is a freemium survey solution that simplifies your data collection efforts.
Register now, create the perfect surveys, questionnaires, and quizzes using simple steps, and watch the insights flow in.
From collecting data to analyzing it, you can make the most of your consumer research with SurveyPoint.
Learn to work smarter, not harder!
Explore our solutions that help researchers collect accurate insights, boost ROI, and retain respondents.
Free Trial • No Payment Details Required • Cancel Anytime


