
If you’re reading this, you likely need a hand with qualitative data vs quantitative data. Don’t worry; we’ve got you covered!
At the basic level, data in statistics can be segregated into two variants: quantitative & qualitative.
Both these data types help you make predictions that are crucial and have an immense impact on your business. Hence, you must be well aware of their significance.
Qualitative data refers to descriptive information that does not involve numerical values or quantities. On the other hand, quantitative data is based on numerical values and consists of measuring quantities or observations.
Combined, qualitative data vs quantitative data can be a goldmine of answers your business might lack. But only if you thoroughly understand and interpret them.
So, in this blog, let’s understand the advantages and disadvantages of qualitative and quantitative data, their differences and similarities, and how to collect and use them correctly.
Advantages and Disadvantages Of Qualitative Data
The following table mentions the advantages and disadvantages of qualitative data:
| Advantages | Disadvantages |
| Provides rich and in-depth insights with context | The sample size is usually small |
| Ideal for exploring themes and patterns | The questions and the data tend to be biased, which results in skewed conclusions |
| It can predict how people will respond or behave when given continuous data | It is hard to analyze or draw conclusions |
Advantages and Disadvantages of Quantitative Data
The table below mentions the advantages and disadvantages of quantitative data:
| Advantages | Disadvantages |
| Quick and easy to collect data and draw conclusions | It doesn’t show you the complete picture |
| The result types will provide you with an idea of which statistical tests to use | As the focus is on numbers, you risk missing out on other information |
| Analyzing and presenting the conclusions straightforward and less biased | It can be inconclusive |
Also Read: Quantitative and Qualitative Research.Qualitative Data Vs Quantitative Data: Differences
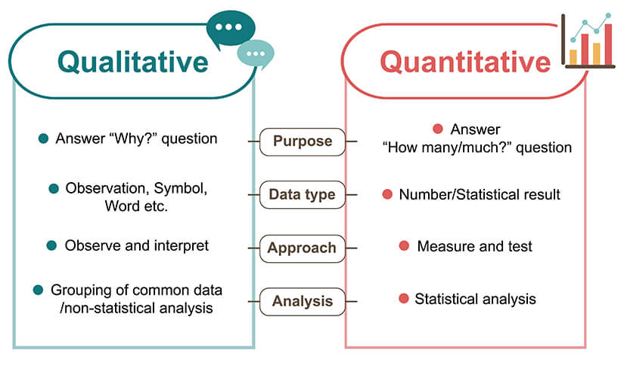
The following table summarizes the differences between qualitative data vs quantitative data with examples:
| Qualitative Data | Quantitative Data |
| It is descriptive, so it is primarily expressed in words. | Consists of numerical data. Thus, it is countable and measurable. |
| Allows you to explore and formulate theories or hypothesis | Allows you to test ideas and theories |
| It is unique and subjective | It is fixed and universal |
| The research method involves interviewing and perceiving | The research method used involves counting and measuring |
| Data is analyzed by sorting it into themes and categories | The data is analyzed through statistical analysis |
| Open-ended questions are used to gather this data | Close (MCQs) questions are used to gather this data |
| Qualitative data examples include gender, religion, qualifications, native language, etc | Quantitative data examples include age, height, weight, income, etc |
When To Use Qualitative Data Vs Quantitative Data
Now that the differences between these data types are understood, let us focus on when you should use qualitative data vs quantitative data.
A general unwritten rule you can follow when deciding which data type to use is:
- If you want to confirm or evaluate something, use quantitative data
- If you want to understand something, use qualitative data
However, as stated, this is only a general rule. Often, you’ll be required to mix up these two options and take a mixed approach to your survey.
How you choose your approach depends on many things, such as whether you’re conducting inductive vs. deductive, experimental, correlational, or descriptive research, your survey question(s), and practical issues such as time, money, data availability, and access to respondents.
Quantitative Research Approach
Imagine you’re conducting a survey at your university about how satisfied the students are with their teachers. You question 300 students and ask them questions like: “How satisfied are you with your professors, on a scale from 1-10?”
Once you have your answers, you conduct statistical analysis and conclude, ‘ On average, students rate their professors 3.75.’
Qualitative Research Approach
Imagine conducting detailed research with 20 students. You ask them open-ended questions such as, “How are you approaching the examination?”, “What is your favorite aspect of the study program and why?” and “What do you think can done to enhance the quality of teaching in the university?”
Once you have the answers of the questions, you can ask follow-up questions to clarify further. You can then use transcription software to transcribe all interviews and draw out behaviors and commonalities.
Mixed Method Approach
You ask students to find out how satisfied they are with their studies. Open-ended questions are a good place to learn new patterns, behaviors, and insights. To validate your conclusions on a larger scale, you can conduct a follow-up survey.
Qualitative Data Vs Quantitative Data: Data Collection Methods
You can collect qualitative & quantitative data using many different methods. But the way you pick them should help you answer the research questions.
Data collection methods can also be divided into qualitative and quantitative methods. More on them below:
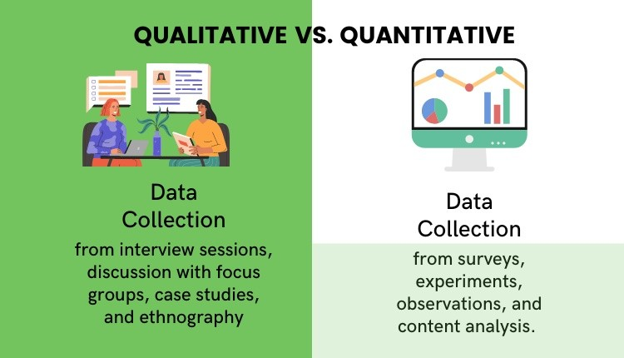
Quantitative Data Collection Methods
- Surveys: Using a list of closed-ended or multiple-choice questions to question subjects. The survey can be done either online, on-call or face-to-face.
- Polls: Like surveys, you question some subjects and assign a numerical value to the same answers.
- Experiments: Observing subjects in control groups and experimental groups in a controlled environment to establish cause-and-effect relationships. Blind experiments, A/B testing, and others fall into this category.
Qualitative Data Collection Methods
- Interviews: Asking open-ended questions to the participants. The medium might be face-to-face or virtual.
- Focus groups: In a focus group, the participants are encouraged by a host to discuss by sharing their personal opinions.
- Literature review: Researching published papers or surveys by other authors.
- Ethnography: Gathering data by participating in a community for an extended duration to observe their culture and behavior minutely.
You Might Also Like: Survey Data Collection: How to Get the Best Results?Wrapping Up
So far, you’ve understood qualitative data vs quantitative data, their differences, and how to gather and use them. But it begs a serious question.
Which data type is better for data analysis?
On one side, you have quantitative data that is thoroughly structured. You can organize, arrange, and analyze it using various statistical methods.
And on the other side, you have qualitative data, which is unstructured. However, this data is unique, subjective, and personalized, which might cause some to say it is inferior to quantitative data.
But that’s not the case. It’s still valuable as it allows you to peek behind your customers’ emotions.
That being said, we are present in a world of numbers, and numbers never lie, thus giving quantitative data a slight edge in this debate.
However, you’re better off using qualitative and quantitative data for the best results.
And SurveyPoint can help you with that!
We’ve got over 100 templates covering all types of questions. You can also create stunning surveys, polls, questionnaires, and quizzes in minutes.
Analyze and visualize your data with our inbuilt analytics platform and create pie charts, graphs, and tables to represent your data visually.
It’s the perfect survey solution to simplify your data collection efforts. Try it out for yourself.
Interested In Sending Your Own Surveys?
Explore our solutions that help researchers collect accurate insights, boost ROI, and retain respondents using pre-built templates that don’t require coding.