Do you have a love-hate relationship when it comes to figuring out regression analysis Vs correlation analysis? Well, not anymore!
Statistical analysis is one of those things that can do wonders for your business. From drregresiving new interested users to your business to improving your revenue, this little thing can do it all.
This is why you must understand what statistical measurements are and what the differences are between them.
Take regression vs. correlation analysis, for example.
You might’ve heard the words before but don’t know enough to understand, compare and apply them to your business.
Don’t worry! We’re here to help. This blog will help you understand correlation and regression in simple terms.
What Is Correlation Analysis?
In simple words, Correlation analysis describes the direct or indirect relationship between two variables.
When two variables are correlated, a change in one variable will directly or indirectly lead to a noticeable change in another variable.
On the contrary, when two variables are uncorrelated, it means that there isn’t a noticeable change when one or the other variable changes.
Mathematically, it can be explained as follows:
“If a change in A makes B change, then they’re correlated. And if a change in X doesn’t change Y, then they aren’t correlated.”
Now, when it comes to business, correlation can be a huge help. For example, say a product has a high demand, the sales will also be high. Whereas if a particular product has no demand, its price will go up, and the sales will drop too.
Key Advantage of Correlation Analysis
Correlation analysis provides you with a distinct and concise summary of the relationship between two variables.
Related: Measurement Scales in Survey. What Is Regression Analysis?
In simple words, Regression analysis describes how one variable can affect the other. You can also think of it as cause and effect. Say, a new variable is introduced (cause), and now, how will it affect the other variables (effect)?
Regression is more about how one variable can affect the other over time and less about the relationship between those variables.
Mathematically, it can be broken down as follows: If A changes, what happens to B? And if B changes, how does it impact A?
Now, regarding business, regression analysis will help you make calculated predictions. Say, for example, by observing how two variables have impacted each other in the past, you can map out how they will continue to affect each other over years, months, and days.
Key Advantage of Regression Analysis
Regression Analysis allows you to get a detailed look at the dataset. It also includes an equation that allows you to predict and optimize the data.
You Might Also Like: Fundamental Concepts For Regression Analysis. Regression Analysis Vs Correlation Analysis: Examples
Just reading the definition isn’t enough to understand Correlation and regression, which is why I’ll be sharing an example each.
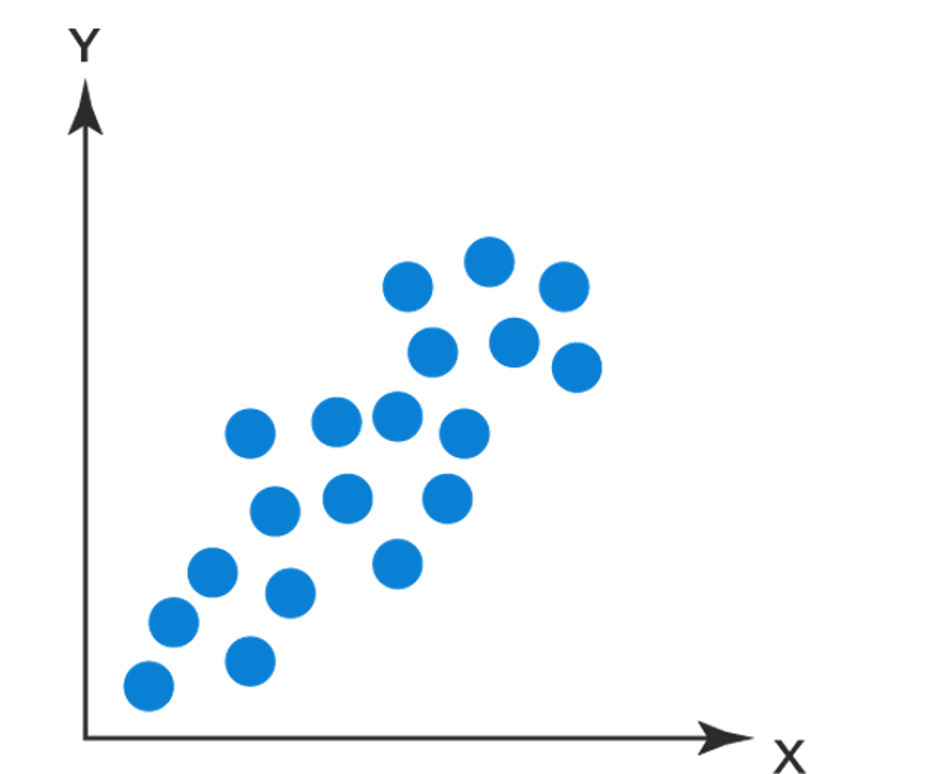
Now, as you know, Correlation is used to establish a relationship between two variables.
Take product price and demand as an example. If the product price is high, the demand for the same will decrease. This is also known as a negative correlation.
On the other hand, an example of a positive correlation is when increased employee satisfaction leads to increased productivity. When employees are truly satisfied with their work environment and working conditions, they tend to be more motivated and productive, thus resulting in better business performance.
As for Regression, you know it is used to determine how one variable impacts another over time.
For example: Based on past records, you can estimate whether a business will generate a profit or a loss.
Now that you’re aware of the examples, it is time we take a look at the regression and correlation formulas.
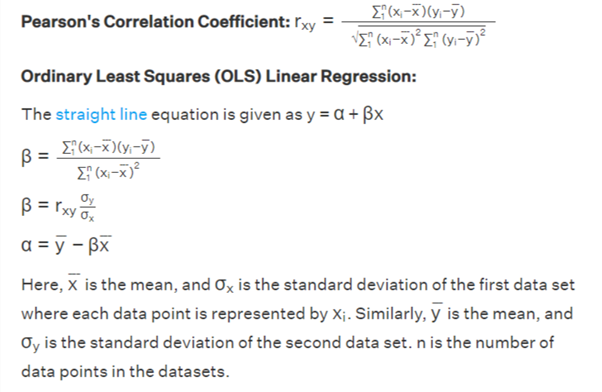
The most efficient way to conduct correlation and regression analysis is with the help of Pearson’s correlation coefficient and by implementing the method of least squares, respectively.
The Regression and Correlation formula is shown below:
ALSO READ: MaxDiff Analysis: How Businesses can Implement it? Regression Analysis Vs Correlation: Differences
Here are some key differences between regression and correlation, with examples that you should be aware of:
- Regression establishes how A impacts B, so the results will change if either A or B are swapped. Whereas with correlation, A and B are variables that can be interchanged without impacting the result.
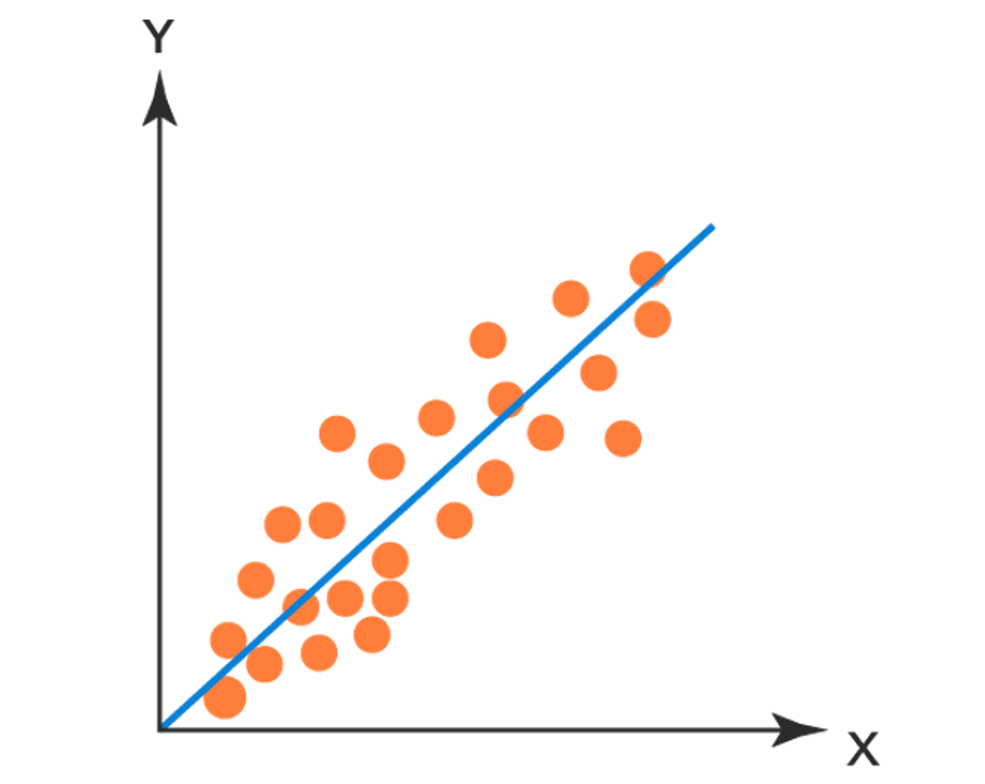
- Correlation is a single number, whereas regression is an equation represented by all the data points shown on a line.
- Regression allows you to see how one variable affects the other, whereas Correlation paints a relationship between two variables.
- Regression establishes cause and effect. When one variable changes, so do the others, irrespective of the direction. Whereas in correlation, the variables move together.
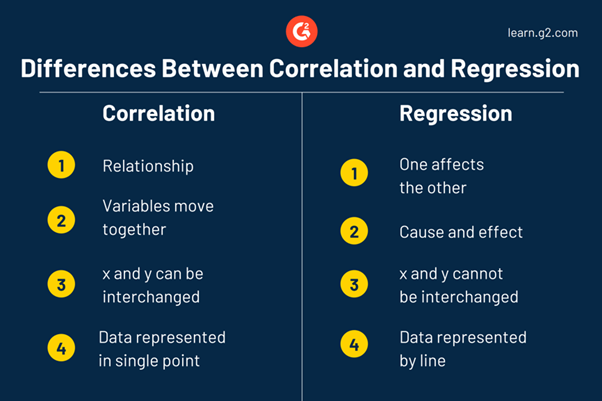
| Correlation | Regression |
| Relationship | How one impacts the other |
| Variables move together | Cause and effect |
| A and B can be interchanged | A and B cannot be interchanged |
| Data represented as a single point | Data represented by a line |
ALSO READ: Using Spearman’s Rank Coefficient Technique To Analyze Survey Data Regression Vs Correlation Analysis: Similarities
Now that you know the differences between regression and correlation, let’s look at their similarities. Understanding the similarities between them will help you better understand your data.
- Both are used to describe an existing relationship between two variables or numbers.
- Anytime the correlation between two numbers or variables is negative, the regression will also be negative.
- The opposite is also true. If the correlation between two numbers or variables is positive, then the regression will also be positive.
Understanding how these two terms differ and are similar to each other allows you to use them to their fullest potential in growing your business.
Conclusion
Often confused as cause and effect, correlation and regression are much more than that.
As a fact, correlation and regression both help you clearly analyze your data. This, in turn, benefits your business if you act upon their generated insights.
So, if you’re thinking of creating a model or an equation to predict a response, Regression is your best bet.
Whereas, if you’re looking to quickly establish a relationship between two variables, Correlation is your answer.
Here’s a simplified table that contains the key similarities and 10 differences between correlation and regression.
| Topic | Correlation | Regression |
| When to use | To establish a quick relationship between two variables | To establish how one variable changes another over time |
| Determines the direction of the relationship | Yes | Yes |
| Determines the strength of the relationship | Yes | Yes |
| A and B are interchangeable | Yes | No |
| A Random | Yes | No |
| B Random | Yes | Yes |
| Cause and effect | No | Attempts To Establish |
| Prediction and Optimization | No | Yes |
| Equation | No | Yes |
| Extension to curvilinear fits | No | Yes |
Regression and Correlation can do wonders for your business if done correctly.
What you need is a tool to unburden you of the taxing manual analysis. This is where SurveyPoint comes into the picture.
Whether you need help collecting data, analyzing it, or helping keep respondents interested, we will handle everything for you.
Not Sure Where To Begin?
Explore our solutions to discover what is most important to your customers,
clients, and prospects. And best of all – it doesn’t take any coding!
Free Trial • No Payment Details Required • Cancel Anytime