
Named after Charles Spearman, Spearman’s rank coefficient is a non-parametric technique for finding the relationship between two variables.
This technique is primarily used for data analysis and is denoted by the Greek letter’ p’ (Rho).
In short, Spearman’s correlation is used to measure the direction and strength between two ranked variables. But, before we get into this, we must understand the Person’s correlation.
What Is Pearson’s Correlation?
Statistically, Pearson’s correlation is a measure to determine the strength of two paired data having a linear relationship. Moreover, to calculate and test these ranking variables, it is essential for the data to meet the following assumptions:
- They must be linearly connected.
- They are distributed bivariant.
- They have an interval level.
RELATED: Inferential Statistics: An Introductory Guide
When To Use Spearman’s Rank Coefficient?
Before you use Spearman’s rank coefficient technique, you must ensure that your data meets the requirements. Explicitly speaking, Spearman’s correlation can be used if the data on your graph exhibits a continuous flow. As you can see from the chart, they have a monotonic relationship and follow a line.
When it comes to monotonic relationships, the variables are closely linked to one another. This emphasizes that if one variable increases, the other tends to increase or decrease, not specifically in a straight line.
In short, the Spearman correlation can be used to study curvilinear relationships. However, the variables must tend to change in a particular direction. Below are some monotonic relation patterns where this technique can be used:
- Positive Monotonic: With one variable increasing, another tends to increase. However, the line may not be in a linear fashion.
- Negative Monotonic: With one variable decreasing, another must decrease, but not necessarily linearly.
The Spearman rank coefficient technique can be a great choice if you are studying ordinal data. To be exact, ordinal data contains at least three categories in a natural order. For instance, ordinal data are first, second, and third in a rally race.
Rho can also analyze the correlation between items on a Likert scale.
Calculating Spearman’s Rho
As a first step, make sure your data is ordinal. It doesn’t need to be changed if it is already ordinal. In contrast, if the data you are dealing with is continuous, you must convert it into ranks before calculating the Rho.
Spearman’s rank coefficients rank from -1 to +1. The signs indicated whether the variables share a positive or negative monotonic relationship. A positive sign would mean that with one variable increasing, the other would increase too. On the other hand, a negative sign implies that with one variable increasing, the other would decrease.
Moreover, if there is no change between the variables, the Spearman rank will indicate a relationship, hence showing Zero.
RELATED: Standard Deviation and Standard Error: Concept and Difference
Formula & Calculations
Here is the formula for calculating Spearman’s rank:
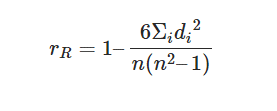
Here,
n = number of data points in the variables
di = rank difference of the “ith” element
In this technique, p (Rho) can rank from +1 to -1.
- If p is equal to +1, there is a perfect rank association.
- If p is equal to -1, there is a negative association between the rank.
- If p is equal to 0, there is no relation between the variables.
Moreover, the closer p is to 0, the weaker the association between the ranks being analyzed.
You must also note that comparing the values at every level is mandatory.
Calculating Spearman’s Rank Coefficient: An Example
The table below shows nine students’ scores in two subjects, history, and geography. The table is ordianlly created. Here rank shows ordinal ranks and implies the difference in the ranks of History and Geography for every student. d square indicates square terms for d.
| History | Rank | Geography | Rank | d | d square |
| 35 | 3 | 30 | 5 | 2 | 4 |
| 23 | 5 | 33 | 3 | 2 | 4 |
| 47 | 1 | 45 | 2 | 1 | 1 |
| 17 | 6 | 23 | 6 | 0 | 0 |
| 10 | 7 | 8 | 8 | 1 | 1 |
| 43 | 2 | 49 | 1 | 1 | 1 |
| 9 | 8 | 12 | 7 | 1 | 1 |
| 6 | 9 | 4 | 9 | 0 | 0 |
| 28 | 4 | 31 | 4 | 0 | 0 |
After you have set your data in ordinal forms, like done in the table above, your next step is (∑d square), which is adding all d square values. In this case, ∑d square equals 12.
Simply add all the values using the formula given above.
In this case,
p = 1-(6*12)/(9(81-1))
=1-72/720
=1-01
=0.9
Here, p is near +1, indicating a perfect association between the ranks.
Merits of Calculating Spearman’s Rank Coefficients
Here are some reasons why this technique can help you analyze the data better:
- Compared to Pearson’s correlation technique, this method is simple to understand and implement. It, however, gives the same results as Pearson’s method, given that none of the ranks are repeated.
- This technique can be helpful if you are analyzing qualitative variables like intelligence, honesty, beauty, or efficiency. In short, this method does not require you to deal with any numerics.
- In contrast, Pearson’s correlation assumes that the parent population is normal based on the sample observations. However, if this assumption is violated, you would need a non-parametric measure to analyze data. This measure makes no such assumptions. Spearman’s technique can help you with that.
- Spearman’s is the only technique to analyze such data if you are dealing with data that can not be measured quantitatively but arranged serially.
- This technique can also be used to analyze numerical data. The data can be converted into an ordinal form in either ascending or descending order to calculate the degree of relation between the variables.
Demerits of Calculating Spearman’s Rank Coefficient
While this method is great for calculating the degree of relationship between multiple variables, it has certain drawbacks. Here are some of them:
- This method can only be used if you are willing to assume the relationship between the variables is linear.
- In case the value of your two variables exceeds 30, you would need to give this technique a lot of time and effort. In short, this is an excellent choice for small data, but this method might not be a great choice if you are dealing with loads of it.
- This method is unreliable if you are measuring the relationship between two variables whose distribution is a grouped frequency distribution.
Let Us Do The Maths for You
Basic Statistics + Comparative Analysis = Tangible Solutions
While it’s simple to spot a disparity between two figures, it requires more work to ascertain whether or not that disparity holds statistical significance. It can be difficult if your research topic has many responses or if you need to compare results from different samples of respondents.
Don’t be hesitant to put money on tools that will make manual Analysis less of a chore. Let SurveyPoint handle everything for you to avoid any unnecessary stress.
Learn to work smarter, not harder!
Explore our solutions that help researchers collect accurate insights, boost ROI, and retain respondents.
Free Trial • No Payment Details Required • Cancel Anytime