
Are you on a quest to understand your customers better? We bet a perceptual map is going to help. It’s likely that you’ve never heard of it before, and you may wonder what exactly it is.
To set things straight, a perceptual map is a diagram to visualize your customer’s perceptions. An excellent way to better understand your customers is to conduct customer surveys. It gives you the information you require to visualize your customer’s wants.
But what happens after you conduct the survey and have all the information in your hand? The solution may lie in perception mapping.
Definition Of A Perceptual Map
Briefly put, it’s a diagram that uses all the survey data to understand what exactly it is that customers think about your brand. In addition, it also gives you a clear perspective of your competitors and a chance to conduct trend mapping efficiently.
While we’re at it, perceptual mapping differs from positional mapping. This is because, unlike positional maps, a perceptual map compares consumer perceptions to actual characteristics.
While positional maps can only compare reality, perceptual maps can forecast consumer behaviors and help you form compelling marketing strategies.
RELATED: How to Ask the Right Questions on Brand Perception Surveys?
Creating Perceptual Maps: 5 Easy Steps
The process of making perceptual maps is relatively simple. Follow these five steps to get started.
1. Choose The Attributes
Choosing attributes is the first and arguably most crucial step in creating any perceptual map. These maps have genuine meaning when you use features that are significant to your target audience. Your target market and customers use these characteristics to contrast your items with your rivals.
Even if their impressions aren’t entirely accurate, remember that this is a perceptual map, not a positional one. Thus, what really matters is what they think. These properties vary depending on the purpose of your map. It’s always a good idea to use those that are significant from a customer’s average point of view as it covers a broad spectrum of your target market.
For instance, the lens quality, zoom, ease of use, or overall memory could be the key attributes when creating a perceptual map for a camera. Similar to how you might choose any two from comfort, design, or durability when it comes to shoes.
2. Set Dimensions
This is the most critical step to do after characteristics. Your map’s proportions allow the customer’s perceptions to be clearly reflected. In this method, each axis is given a numerical value. More numbers will result in better mapping.
As a result, mapping the axis in twos will yield a more accurate result than mapping it in fives. Therefore, perceptual maps must have proper dimensions to reveal more precise data.
3. Decide Products To Track
Let’s take the example of shoes. Different shoes from various brands or styles must be chosen in order to create a perceptual map for shoes. These companies might be rivals of yours or associates with your line of goods.
This stage is essential to improving the effectiveness of your map because, if you pick the proper goods, client perceptions of the map may prompt necessary improvements.
4. Conduct A Survey
The best way to gather data for perceptual maps is through surveys. With SurveyPoint, creating surveys is as easy as it can get, enabling you to move quickly into analysis and actual mapping.
All models and brands use the same question format, and at the conclusion, you’ll receive a scale value for comfort and design for each shoe brand. Naturally, the scale value will change depending on the selected dimensions.
Open-ended questions can be utilized in this situation as well, but as we’ll see, they won’t have obvious solutions. For perceptual maps, it is, therefore, advisable to stick to such scale-type issues.
RELATED: A Guide to Perception Surveys: Types and Sample Questions
5. Perceptual Map
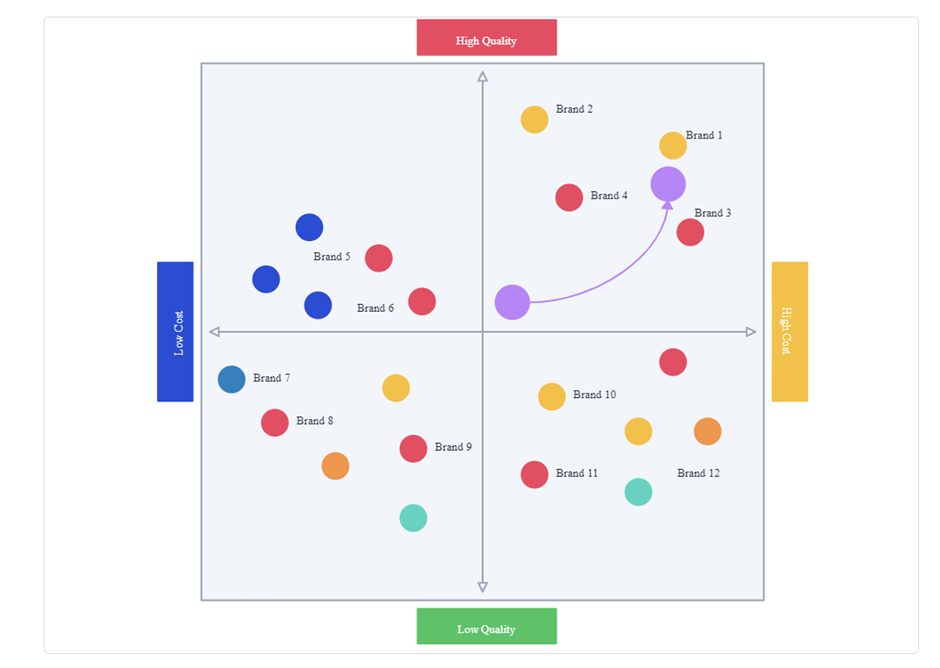
It’s time to create your perceptual map and plot the results once you’ve scored the brands utilizing their merchandise or directly the brand. Creating line graphs is the simplest step, and it is similar to drawing them in school.
One of the chosen attributes is represented by the X-axis with its pre-fixed dimensions, and the Y-axis defines the other attribute with its own dimensions. If you plot it, you’ll get a clear image of how the client sees a particular product category.
Wrapping Up
Perceptual maps can be a great technique to get to know your customers better. They hint at their proposed behaviors and give your surveys more meaning, allowing them to be a smacking success. Follow the tips above to create your maps, and make sure you carefully choose the attributes.
Not sure where to begin?
Explore our solutions to discover what is most important to your customers, clients, and prospects. Brownie points – it doesn’t take any coding!
Free Trial • No Payment Details Required • Cancel Anytime
Heena Shah – Content Writer at Sambodhi