
Research refers to the academic practice of undergoing rigorous study, survey, and analysis of a new topic, mainly in the field of social sciences, but it is also crucial in the scientific disciplines. Data plays an essential role in drawing valuable insights on different subjects. You can opt for dedicated data analysis in research and identify trends for improved understanding.
Natural sciences conduct research to find new solutions to modern-age problems. Social sciences, on the other hand, conduct research to know the reasons for phenomena that have already taken place. They tend to study how human psychology works, how geography affects lifestyle, how consumption affects climate, how politics and governance have been faring in a field, etc.
Research involves multiple steps before one reaches the data analysis part. The collection of data through surveys is the most critical step that precedes data analysis. Conducting a survey is an exhaustive practice in itself.
On the other hand, data analysis is a diversified activity and is done for multiple reasons in various ways. Let us explore the role of data analysis in the research below.
What is Data Analysis in Research?
Data analysis is a scientific technique for sharing information about a certain subject by examining the collected data. Data collection, categorization, analysis in line with the data’s structure, and the generation of conclusions based on the analysis performed are only a few of the duties involved.
Despite this, data analysis is not a set rule. It is up to the research scholar to include more steps that are relevant to individual processes. There are multiple types of data analysis in research, depending on your objective.
ALSO READ: Popular Data Collection Methods To Draw Meaningful Conclusions
Understanding The Value of Data
It is necessary for us to first understand what data is before we proceed toward exploring data analysis. Data refers to a set of variables that qualify or quantify some answer to the posed problem.
For example, responses collected for the question about the number of siblings a person has constitutes data. Another example of data can be a set of responses that answers the question, ‘What is your preferred ice cream flavor?’.
Data can be recorded in both discrete and continuous values. Discrete data, as the name suggests, is measured in whole numbers and is isolated from the rest of the results. The number of vehicles owned by the households in the given locality will constitute discrete variables. People can’t have two and a half vehicles. The number of vehicles will always be recorded in countable values like 1, 3, 4, etc.
Continuous data has an infinite number of possible answers between two discrete values.
For example:
The weight of a person will rarely be exactly 60 kg or 75 kg. There is a high chance that the weight will come out to be 60.23 kgs or something else like this.
Hence, we can deduce that discrete variables are used for counting while continuous variables are used for measuring.
Why Opt For Data Analysis in Research?
To begin a research study, you must collect data, because you want to get all the facts straight. However, the data analysis’s processing phase is an essential stop on the way from raw data to useful insights.
It is vital to gauge the importance of data analysis in research to make it a necessary step in your process.
By the time a research scholar does not analyze data, the collected responses do not make any sense. No one can interpret 100s and 1000s of responses to infer conclusions by the time they are not organized. Data organization is a crucial element of data analysis, and hence, it is essential.
ALSO READ: Market Research Made Simple: Tips and Tricks
Data Analysis in Research: Quantitative & Qualitative
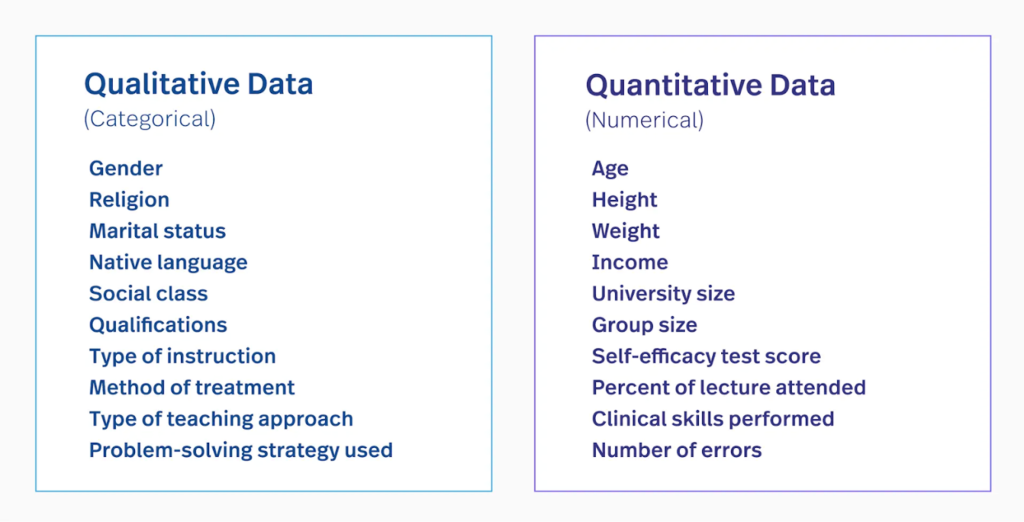
Data can also be recorded in qualitative terms. It is usually derived because of the open-ended questions or questions which have the option of answers other than the ones already mentioned to be chosen from. Qualitative data is neither used for counting nor for measuring. Rather, it is used for having conceptual and descriptive explanations of a given problem.
Analysis of Quantitative Data
Quantitative data can be easily interpreted with the help of statistical tools. The simpler form of quantitative data analysis is the descriptive type of statistics. It includes calculating the given variables’ mean (average), median, mode, standard deviation, or skewness. Calculating these values does not require elaborate mathematical calculations.
Researchers working with small samples or just starting out can use this type of data processing. For instance, in colony A, a survey could ask each home the same question to determine the number of air conditioners present.
The sum of the values can be divided by the total number of values to determine the average number of ACs. Knowing the mode will be a better choice, but if you want to understand the social standing of society.
Inferential statistical methods are another means to perform data analysis. However, they are more complex and need to be employed under expert knowledge. It focuses on the distribution aspect of the variables, and some of the tools are hypothesis tests, confidence intervals, and regression analysis.
Qualitative Data Analysis
This method is all about identifying themes and patterns from an ocean of varied responses. Data collected in qualitative form can be open or close-ended, depending on the subject’s demand.
Close-ended questions are still easier to be analyzed using descriptive statistical methods on numerically marked qualitative variables. However, analyzing open-ended qualitative data can be a tricky task. Such responses can be used to infer results and the plausible reasons behind a cause.
ALSO READ: Quantitative and Qualitative Research: Definitions and Key Differences
Conclusion
Data analysis in research aids in the comprehension of both the study’s goals and the target sample’s perspectives on those goals. Results will be skewed if the sampling of the population, the questions on the questionnaire, the rigidity of the enumerators, and other factors have an adverse effect.
However, data analysis is highly dependent on the quality of the data collected. If the sampling of the population, the questions in the questionnaire, the rigidness of the enumerators, and other factors play a negative impact, then the results incurred will be flawed. Also, statistical measures of analysis are not true to their entirety when used for social issues.