
A perceptual map is a type of marketing research tool used to visually demonstrate how consumers perceive a brand, product, or service in comparison to competing offerings. It is used by marketers to better understand customer perceptions and make decisions regarding market positioning, product development, and advertising strategy.
The map is typically a two-dimensional chart that plots the perceived attributes of a brand or product. This is compared to the offerings of the rival.
In the following blog, we aim to explain the concept of perceptual mapping, highlighting some of its most effective use cases. We also discuss a comprehensive guide on how to construct one from scratch.
Types of Perceptual Maps
Knowing which perceptual map to use is essential, as it helps organizations identify which element of their brand is their USP. Also, what areas need further work. The following are the types:
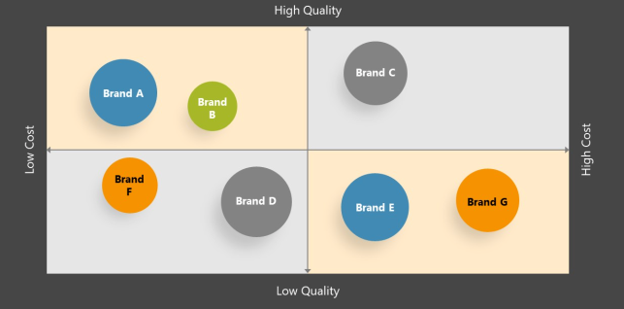
1. Position Map: A position map visually represents how customers perceive a brand or product relative to competing brands or products. It typically includes numerical ratings such as price, quality, value, etc.
2. Feature Map: A feature map is a perceptual map showing how customers perceive different features of a brand or product relative to competing brands or products. It typically includes numerical ratings such as design, usability, performance, etc.
3. Benefit Map: A benefit map shows that customers perceive different benefits of a brand or product relative to competing brands or products. It typically includes numerical ratings such as convenience, reliability, comfort, etc.
4. Image Map: An image map displays how customers perceive a brand’s or product’s image relative to that of competing brands or products. It typically includes numerical ratings such as prestige, sophistication, modernity, etc.
How to Make a Perceptual Map?
To make a perceptual map, there are a few broad steps:
- Gather data: Start by collecting data on the perception of your product or service. This can include customer surveys, competitor research, and market research.
- Define variables: You need to decide on the two key variables that you want to measure. You can employ variables such as price, quality, design, etc.
- Create a survey: Create a survey that will help you collect data on the two variables that you have chosen. You can use this survey to gain insights from your customers or target audience.
- Analyze the data: Conduct data analysis and create a graph that plots the two variables against each other. You will have a visual representation of your product or service that is data backed.
- Interpret the map: Interpret the graph and use it to make decisions about your product or service. This will help you understand the customer’s perception and make changes or improvements to your offering.
ALSO READ: A Guide to Perception Surveys: Types and Sample Questions What is the Process to Make a Perceptual Map in Excel?
One should implement the following steps to create a perceptual map in excel:
- Create a new spreadsheet in Excel and set up the columns. You can label the first column as “Brand,” the second “Price,” the third “Quality,” the fourth “Size,” and the fifth “Image.”
- Then, enter the names of each brand or product that you want to compare in the “Brand” column.
- Enter the corresponding prices, quality ratings, sizes, and images for each brand in the remaining columns.
- Select the five columns and insert a chart. Choose a scatter plot chart type.
- Set the x-axis and y-axis labels while formatting the chart. You do it according to the corresponding dimensions of your perceptual map. For example, you could set the x-axis to “Price” and the y-axis to “Quality.”
- Select each data point and add a label along with the brand name. This will further make it easier to identify each brand on your map.
- Besides, you can also add gridlines to the chart if you want a more visually appealing map.
- Add a title to the chart, and you now have your perceptual map!
ALSO READ: Understanding Your Customers Better With A Perceptual Map Advantages of Using Perceptual Mapping
Every business wants to grow organically. With perceptual mapping, one can reap the following benefits:
- Provides Insights into Market Segmentation: Perceptual mapping can identify different types of customers within a market, which can be used to better target a company’s marketing efforts.
- Enhances Brand Positioning: This type of mapping helps companies understand how their brand is perceived in comparison to competitors. This can provide valuable insight into how a company can differentiate itself, reinforcing its unique brand position in the market.
- Helps to Develop New Products and Services: Companies can use perceptual mapping to identify gaps in the market where they can develop new products and services. This can help a business drive growth and innovation, as well as keep existing customers loyal.
- Improves Customer Satisfaction: By aiming to understand the preferences of customers in various segments, a company can provide more tailored products and services that better meet customer needs. This can help improve customer satisfaction.
Limitations of Perceptual Mapping
With many benefits, there are several limitations that come with it:
- Perceptual mapping does not consider the actual pricing of the products in comparison.
- It makes it difficult to account for a changing marketplace, as the data collected may become outdated.
- The process is limited with respect to the resources available to the researcher. As the procedure can be expensive and time-consuming to collect the necessary data.
ALSO READ: Defining Product Roadmap Designing— and How to Create One!Conclusion
Perceptual maps are an invaluable tool for marketers to understand their target customers’ perceptions of their brand. It enables marketers to develop strategies to capitalize on their strengths and improve their weaknesses in order to stay competitive.
Ultimately, perceptual maps provide a visual representation of the customer’s perception of a brand and its competitors. So, it helps business owners make smart choices and keep pace with the competition.
Not Sure Where To Begin?
Explore our solutions to discover what is most important to your customers,
clients, and prospects. And best of all – it doesn’t take any coding!
Free Trial • No Payment Details Required • Cancel Anytime
