
What is interval data? How is it collected and measured? And how do you analyze it? This blog has the answers to all your questions. Read on!
Whether you work in sales, marketing, or sciences, you cannot escape data analytics.
And one of the most commonly used data formats in these sectors is interval data.
You don’t have to be an expert analyst to understand it (unless you’re a statistician). You simply need to have a basic grasp of the concept. And this blog is going to help you with it.
This blog will explain in layman’s terms what interval data is, its characteristics and examples, and how you can gather and analyze it.
So, let’s jump right into it!
What Is Interval Data?
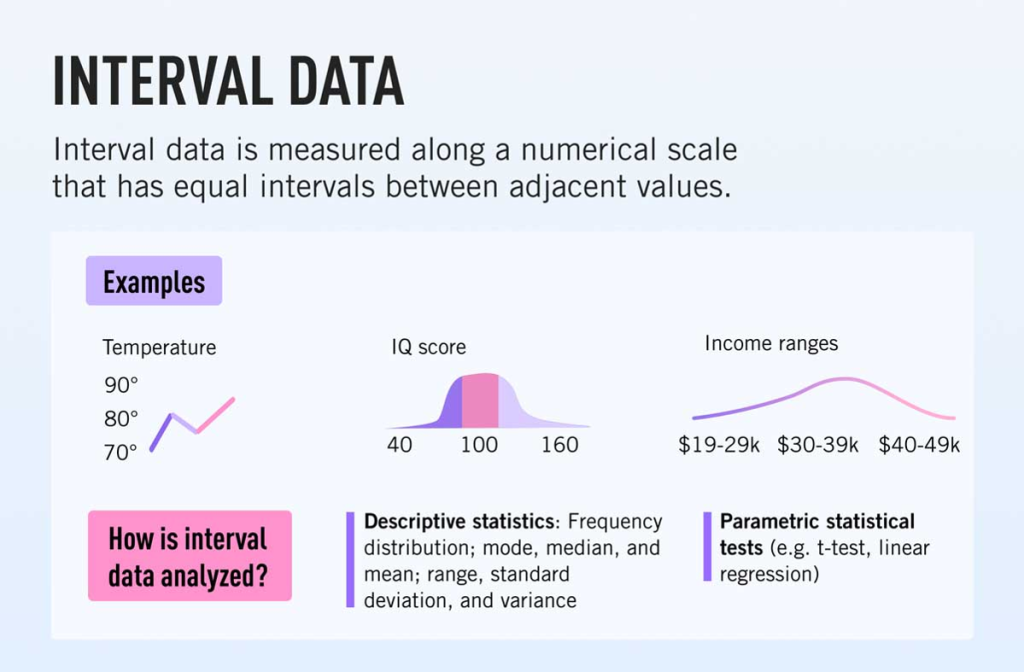
It is a type of quantitative (numerical) data that is measured along a scale.
Here, the variables are grouped into categories, and equal intervals exist between any two given variables.
An example of interval data is the data generated by a thermometer. Here, each marking on the thermometer directly follows the previous one and is equidistant.
This type of continuous data is advantageous as it allows you to perform certain mathematical operations. Meaning you can perform addition and subtraction to determine the difference between variables.
When discussing interval vs. ordinal data, interval data takes the upper hand as it has precise numerical values allowing you to perform statistical analysis. Before we move on to the characteristics of interval data, let’s look at more examples of interval data.
Related: Nominal, Interval, Ordinal Scale: A Guide To Measurements & Data Scales Interval Data Examples
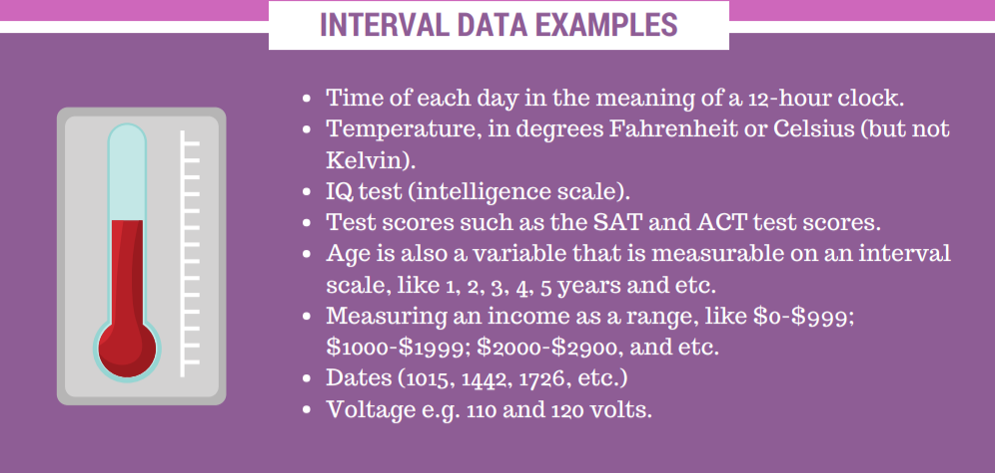
- Calculating intelligence scores using an IQ test as there is no zero point in IQ. A person cannot have zero intelligence; hence the zero here is entirely arbitrary.
- Consider a 12-hour clock used to measure time during the day. Each number is equidistant from the other, thus making it possible to measure and compare them. The difference between 1 and 11 minutes is the same as between 30 and 40 minutes.
To sum up, interval data is all about measuring the variables on an equidistant scale where the zero point is an arbitrary entity. Now, let’s take a look at what characterizes interval data.
Key Characteristics of Interval Data
Here are some key characteristics of interval data:
It Is Quantitative
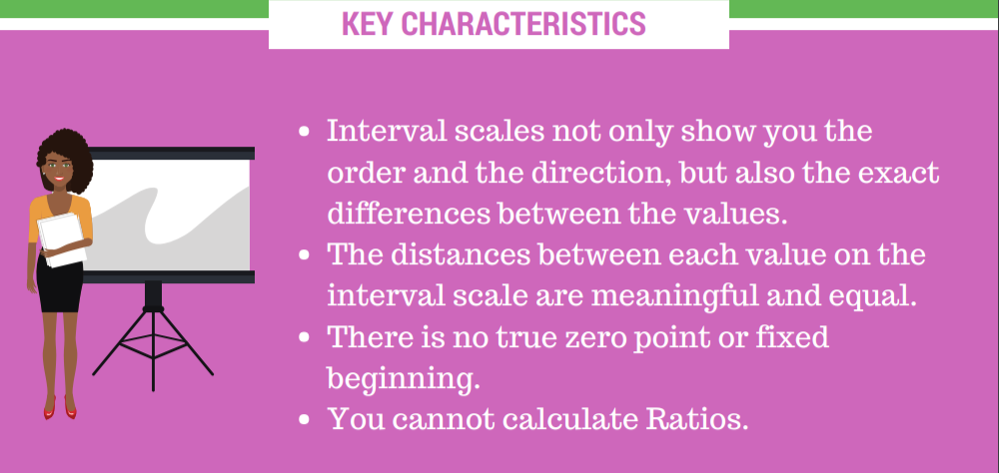
Meaning you can measure it on an interval scale. Thus allowing you to not only determine the order and direction of the variable but also tell you the exact difference in the values.
It Can Handle Arithmetic Operations
You can perform addition and subtraction on interval data but cannot perform multiplication and division. Using interval data, you can also determine its mode, median, and mean values.
Moreover, you can also calculate the dataset’s range, standard deviation, and variance.
It Has A Negative Reading
You can measure interval data (aka integer data) using negative values. As an example, consider the stock prices when the stocks crash.
On the other hand, interval scales cannot display zero.
It Has Equal Intervals
On an interval scale, the markings are central, meaning that the difference between each interval is the same.
For example, the difference between 5 cm and 10 cm is the same as between 90 cm and 95 cm.
It Has A Point Zero
An interval scale has a point zero value which is arbitrary. Thus, you cannot measure a variable that has a zero value.
Consider how you can measure negative temperature but cannot measure negative height.
Now that you know how to identify interval data, let’s move on to how you can collect this data.
How Can You Collect Interval Data?
You can gather interval data in multiple ways.
Each collection method considers how the data will be managed and the nature of the target audience. Here are some ways you can collect interval data:
Observation
Here, the researcher documents a direct observation. An example would be calculating the number of new visitors your website receives daily, weekly, or monthly.
Interviews
Here, some random target audience members are questioned to retrieve a certain amount of data. It can be done via online personal interviews, telephone interviews, or face-to-face interviews.
The goal is to collect data on how different participants behave and respond to the same questions.
Surveys & Questionnaires
Surveys and Questionnaires help businesses obtain feedback about their products or services.
Based on the responses, businesses can tweak their products or services to fulfill the customers’ needs.
Also Read: How to Create Effective Brand Survey Questions? Probability Sampling
Here, a sample is selected randomly from a population to draw conclusions about the entire population.
Each member of the population has an equal chance of being selected through probability sampling. Thus, ensuring that the sample is representative of the population and reduces biases.
How To Analyse Interval Data?
You can use a wide range of methods to analyze interval data. To measure interval data, you can primarily use two types of analysis – descriptive and inferential statistics.
Descriptive statistics provide you with a summary of a dataset. On the other hand, inferential statistics compare samples and offer you insights based on the results.
Let’s have a look at some common techniques you can use to analyze interval data.
Descriptive Statistics For Interval Data
You can use the following descriptive statistical methods to analyze interval data:
- Mean: To calculate the average value of the sample
- Median: To determine the central value of your sample
- Mode: To determine the value that appears the most in your sample
- Standard Deviation: To measure how varied a dataset is from the average (or mean) value
- Variance: To measure the variability of a dataset from the mean
Inferential Statistics
Some ways of analyzing interval data using inferential statistics are as follows:
- Trend Analysis: To draw trends and insights from the collected data.
- SWOT Analysis: To evaluate a business’s strengths, weaknesses, opportunities, and threats.
- Conjoint Analysis: To examine how customers make complicated decisions on an interval scale.
- TURF (Totally Unduplicated Reach and Frequency analysis) Analysis: Is used to determine the optimal combination of products, services, or media channels that will reach the maximum possible target audience with the least overlap.
You Might Also Like: Nominal Data Analysis: Definition & Steps Conclusion
Interval data is one of the most commonly used data types and has some distinct features that set it apart from the other data types.
As opposed to nominal and ordinal data types, interval data ticks all three boxes regarding identity, magnitude, and equal intervals. As a result, it’s a fantastic resource for conducting follow-up studies and drawing inferences.
Therefore, businesses use it to improve their products.
You can use it, too, to improve your business and better understand your customers.
SurveyPoint offers a convenient way to register and create surveys, questionnaires, and quizzes with ease. With just a few simple steps, you can design perfect surveys and quizzes to generate insightful results.
So why wait? Sign up today and start unlocking valuable insights for your business or research.