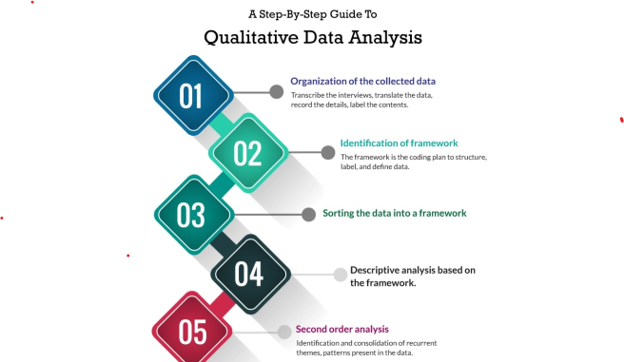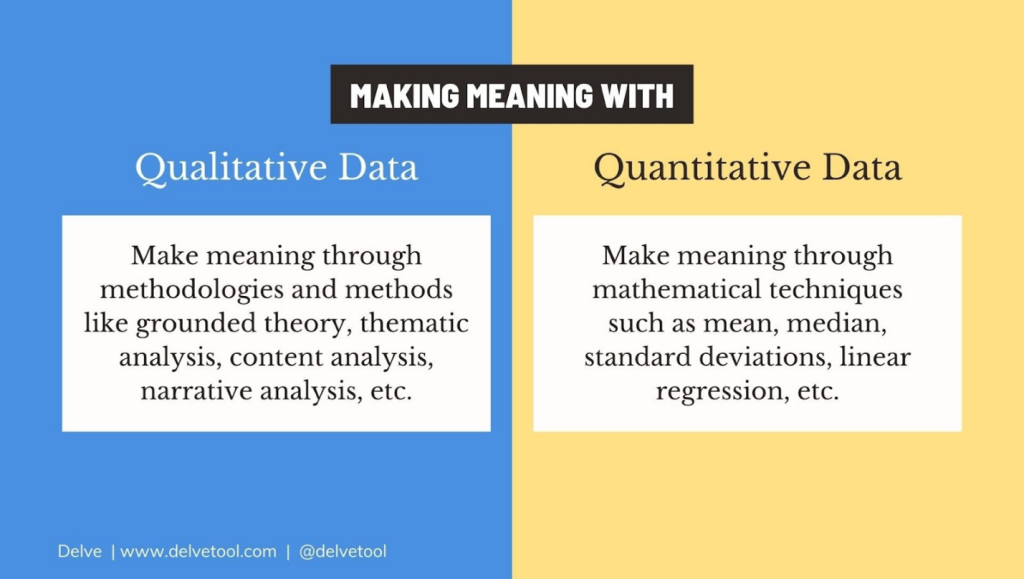
Data interpretation helps us understand and make sense of the information presented in the data. It involves data analysis to identify patterns, trends, relationships, and other meaningful insights. Drawing valid conclusions from data sets requires logical reasoning and critical thinking.
Data interpretation can be qualitative or quantitative in nature and is used to inform decisions, guide actions, and enable a better understanding of data. But how can we interpret it?
How Can You Interpret Data?

The process of interpreting data is intended to help individuals comprehend numerical data that has been collected, analyzed, and presented.
By establishing a method for interpreting data, your analyst teams will have a consistent and structured foundation. In fact, if multiple departments use different approaches to interpreting the same data while working towards the same objectives, it can result in conflicting goals.
Using various methods can lead to duplicate efforts, inconsistent solutions, wasted resources, and ultimately, a loss of time and money. In this section, we’ll examine the two primary data interpretation methods: qualitative and quantitative analysis.
Different Ways of Qualitative Data Interpretation
Interpreting qualitative data entails sifting through information for hidden meanings, such as trends or themes. This type of data is usually gathered through the following techniques:
- Interviews
- Focus groups
- Observations
- Document analysis
This interpretation of data involves examining the data for patterns, trends, and themes that can give insight into a particular phenomenon. It also requires careful consideration of the data’s implications for the research question or hypothesis being investigated.

It is important to know that qualitative data interpretation can be done in a variety of ways:
- Content Analysis
This research approach recognizes recurring themes, topics, and concepts. This method converts qualitative information into quantitative data. Thus, aiding in identifying patterns that can support important research or business decisions.
To improve their goods and services, marketers gain insightful information. Manually implementing this method can be very time-consuming. In addition to being prone to human error or subjectivity issues, it is therefore recommended to use content analytics tools for conducting content analysis.
- Thematic Analysis
Techniques like interview transcripts or survey responses are used in thematic analysis. Researchers can gain insights into the experiences and attitudes of the participants by sorting the data according to common themes.
Its exploratory nature encourages researchers to approach their analysis with flexibility and an open mind. This approach reveals unexpected patterns that may not have been initially considered. Therefore, researchers should adapt their research questions or goals based on the insights they gain from their data.
- Narrative Analysis
Narrative analysis is a more precise method. It involves examining stories to unravel their underlying significance. The sources of these stories can include testimonials, case studies, and interviews.
These allow individuals to elaborate more on their experiences. Due to the difficulties in data collection, sample sizes for narrative analysis are typically smaller. This makes it more challenging to replicate its findings. Nevertheless, narrative analysis remains a valuable approach to understanding complex and personal experiences.
Regardless of the method of interpretation, it is important to remember that qualitative data interpretation is an ongoing process. As new data is gathered and analyzed, the interpretations may change. You should be aware of the researcher’s own biases and assumptions when interpreting qualitative data.
Quantitative Data Interpretation
Quantitative data interpretation is like a puzzle-solving game, where the pieces are ‘numbers,’ and the solution is ‘insight.’ It is the process of analyzing and interpreting numerical data in order to draw meaningful conclusions from it.
Other distinctive methods for interpreting quantitative data include:
- Regression Analysis
Analyzing data lets us learn how many factors are connected and make informed forecasts. Both economic and market forecasting rely heavily on it.
Applying statistical models to a dataset allows analysts to deduce the nature of the ties between its constituent parts. Future results can be predicted with this information.
ALSO READ: Fundamental Concepts For Regression Analysis- Cluster Analysis
This type of analysis identifies groups of similar objects. It is often used in marketing research to identify customer segments.
Clustering involves grouping similar data points together, which can be used to identify hidden patterns in the data. Age groups, geographic information, and earnings are just a few of the things it is frequently used for.
- Predictive Analysis
The predictive approach forecasts future trends based on both past and current data. Predictive analytics is a practice supported by modern artificial intelligence and machine learning technologies. Businesses can identify patterns or potential concerns and make informed strategies in advance.
- Conjoint Analysis
The conjoint approach is a useful tool for analyzing how individuals evaluate various features of a good or service.
Being aware of the choices made by consumers can help you decide on pricing, packaging, and other essential aspects. By using this method, analysts can verify which characteristics matter to consumers the most and how they may influence their purchasing decisions.
ALSO READ: Descriptive Analysis in Research: Meaning, Types, and ExamplesWhy is Data Interpretation Important?
- Data interpretation helps identify trends, patterns, and relationships in data points.
- It enables us to draw meaningful insights from raw data.
- Data interpretation helps to make informed decisions and strategies by understanding correlations and trends.
- It helps to identify potential problems and opportunities.
- It helps businesses use their data more effectively and efficiently.
- Data interpretation helps to forecast and predict future trends.
- It helps enhance the customer experience as it aims to understand customer needs and preferences.
- It helps to make data-driven decisions and strategies.
- It helps to identify areas where improvements can be made.
Conclusion
Data interpretation allows you to uncover valuable insights from data sets and make data-driven decisions. With AI and data being widely used, it is crucial for professionals and businesses to understand dataset analysis for significant growth.
Not Sure Where To Begin?
Explore our solutions to discover what is most important to your customers,
clients, and prospects. And best of all – it doesn’t take any coding!
Free Trial • No Payment Details Required • Cancel Anytime


