Navigating Chart Gallery In SurveyPoint
With SurveyPoint, you can access custom-made, automatic chart galleries that allow you to analyze the data collected like a pro and make informed decisions based on that data.
In a chart gallery, you can view or edit your data and use default charts from Chart Gallery to create your own analysis report.
As a result, you are able to analyze the data more effectively and formulate informed decisions.

- Explore the chart gallery features available for data visualization by going to the “Analyze” section of the platform.
- Once you do that, you will be redirected to the Analyze panel, where you can view your Chart Gallery.
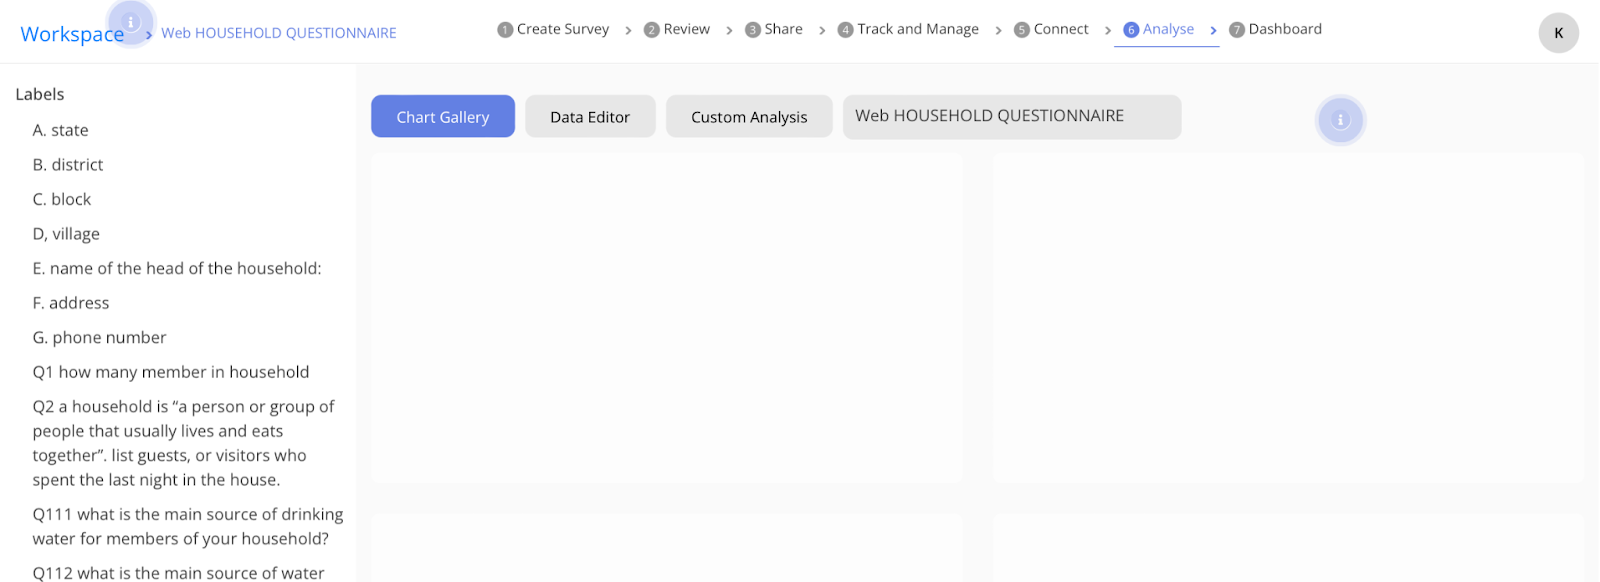
- The questions you’ve added will show up on the side panel. If the survey has any charts, they’ll be displayed on the right side of the screen.
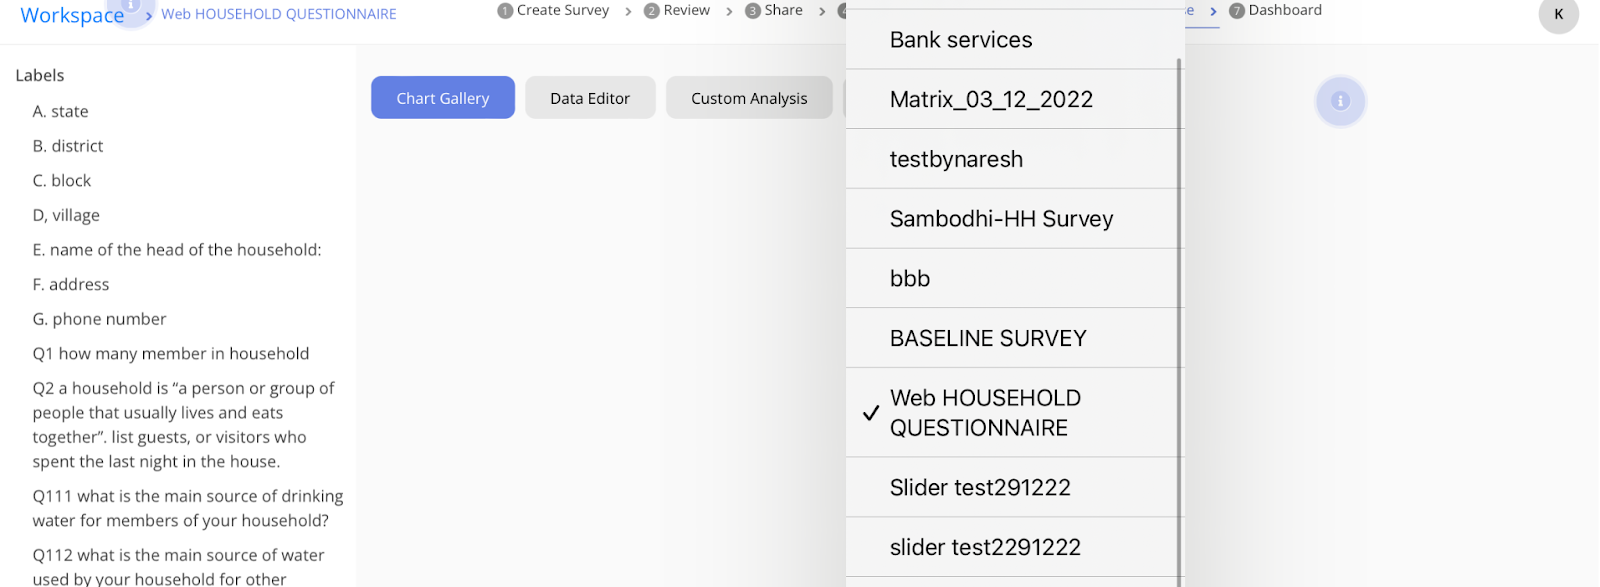
- If you want to analyse the data of another survey, click on the Survey Title, located right below the top bar.

- Once you click on the title, simply select your survey from the drop-down menu.
- To create a chart for a specific question, simply double-click on the question in the list on the side panel. The server will then generate the chart for you automatically.
Hope that solves all your doubts. However, if you still have questions, we are here to help.
For further assistance, please email us at connect@surveypoint.ai. Our team will promptly respond to your inquiry.


