Using Custom Analytics To Analyze Survey Data & Make Survey Reports
Data collection is only the first step; analyzing the results is where the real work begins. With the custom analytics feature in SurveyPoint, you can easily turn data into actionable insights.
From identifying trends and patterns to making informed decisions, the custom analytics feature helps you optimize your sales and marketing strategies and make the most out of your survey data.
For bi-variable analysis in SurveyPoint, you can use the custom analytics option. Data-driven decisions can be made by analyzing and visualizing bi-variables to reveal underlying patterns and relationships.
Let’s learn how to elevate your analysis game with SurveyPoint.
- To access Custom Analytics in SurveyPoint, open your workspace >> Analyse >> Custom Analytics.


- To view the options, click on “Custom Analytics” and explore all the available features.

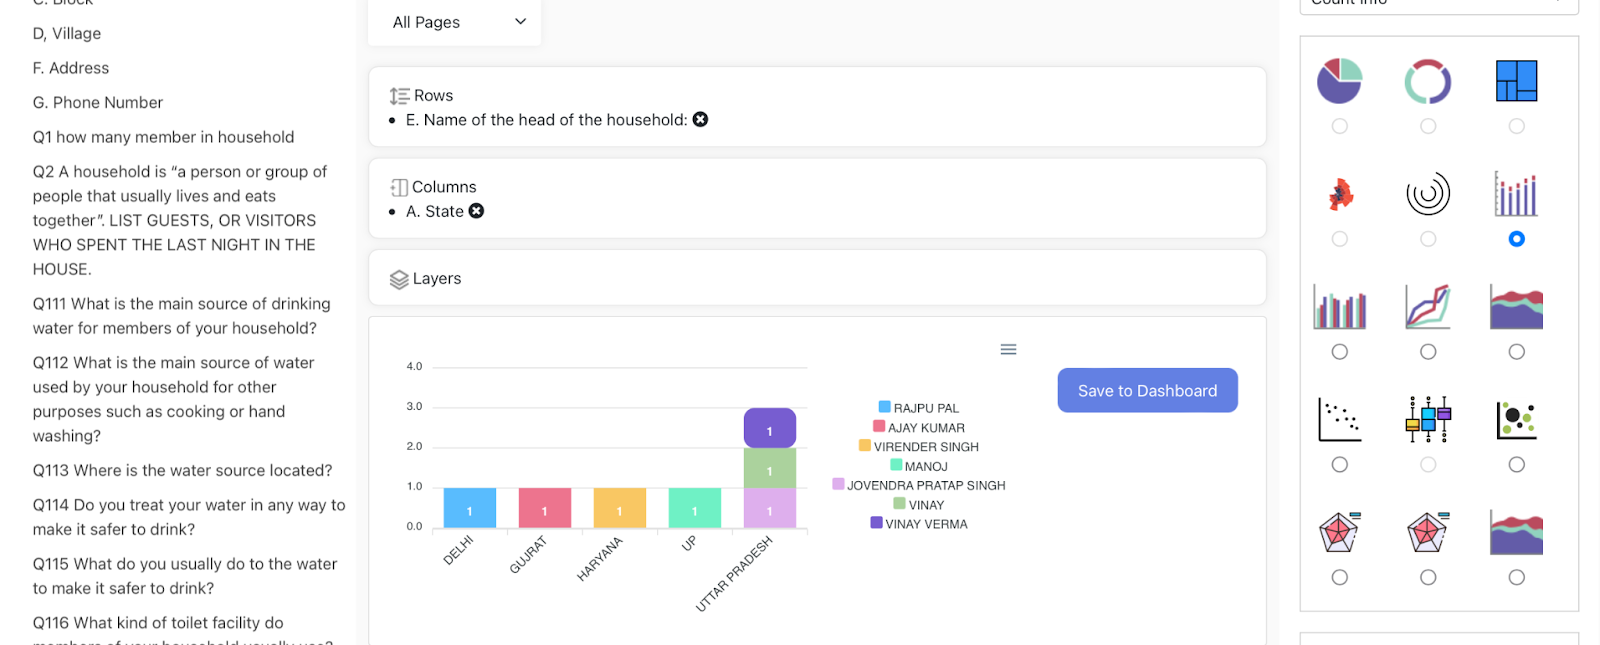
- Once you click on Custom Analytics, you will be redirected to a page shown in the above image.
- ‘Customize charts’ let you visualize collected data through bar charts and pie charts.

The data visualization will appear in the middle of the screen once you add rows, columns, or layers.

- All the questions you have included in your survey will list under the ‘Labels’ section on the left sidebar.

- Simply, drag and drop a question from the labels panel to the desired row, column, or layer, and generate your own unique analytics.
?INSIGHT In data analysis and visualization, “bi-variables” refers to analyzing and visualizing the relationship between two variables. There are no restrictions on the type of variables used; they can be numerical or categorical and continuous or discrete. The goal is to understand how changes in one variable affect the other and to identify patterns or trends in the data. This type of analysis is often done using scatterplots, which show the relationship between the two variables by plotting their values on two axes. Other types of visualization, such as line graphs or bar charts, can also be used to show the relationship between two variables, depending on the nature of the data. |
- You can change the bar graph design from the ‘customize chart’ panel and choose the preferred design.

Display Options
You can modify the display settings by accessing the Display Options in the right sidebar.

- Table view: A table view in custom analysis shows data in a row and column format, where each row represents an observation, and each column represents a variable. It’s an easy and convenient way to summarize data and is commonly used to display the main characteristics of a data set.
- If you prefer to view the analysis in a tabular format, simply choose the Table View option. In case you wish to display percentages in the table, you can select both Row % and Column %.

- To keep these visual analytics readily accessible for future use, you can click on the “Save To Dashboard” option and store it in your dashboard.

- Frequency view: The frequency view is a type of table that presents the number of times a unique value occurs in a variable. It is an effective way to summarize the distribution of nominal or categorical variables. This view helps you to identify the most and least frequent values, as well as any unusual or unexpected values in your data.
- If you wish to examine the frequency of your variable, simply select Frequency View from the available display options.

- Word Cloud: A word cloud is a visualization used in custom analytics to display the most commonly occurring words or phrases in a dataset. The size of each word in the cloud corresponds to its frequency in the dataset.
It enables viewers to rapidly comprehend vast information without needing to count or meticulously review notes.

- If you want to analyze the data of another survey, click on the Survey Title, located right below the top bar.

- Once you click on the title, simply select your survey from the drop-down menu.

Hope that solves all your doubts. However, if you still have questions, we are here to help.
Write to us at connect@surveypoint.ai, and our team will connect with you shortly.


